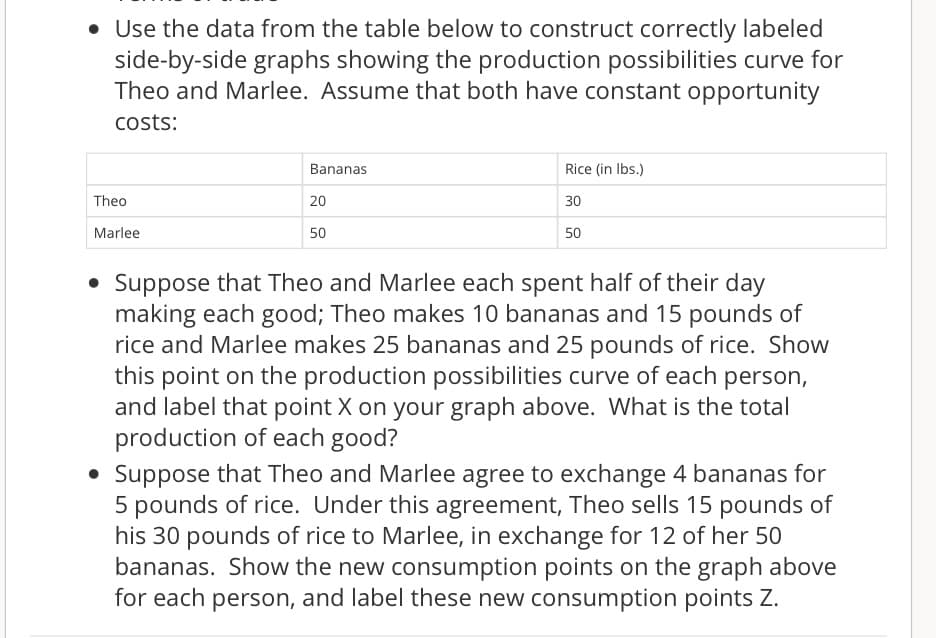
• Use the data from the table below to construct correctly labeled side-by-side graphs showing the production possibilities curve for Theo and Marlee. Assume that both have constant opportunity costs: Theo Marlee Bananas 20 50 Rice (in lbs.) 30 50 • Suppose that Theo and Marlee each spent half of their day making each good; Theo makes 10 bananas and 15 pounds of rice and Marlee makes 25 bananas and 25 pounds of rice. Show this point on the production possibilities curve of each person, and label that point X on your graph above. What is the total production of each good? • Suppose that Theo and Marlee agree to exchange 4 bananas for 5 pounds of rice. Under this agreement, Theo sells 15 pounds of his 30 pounds of rice to Marlee, in exchange for 12 of her 50 bananas. Show the new consumption points on the graph above for each person, and label these new consumption points Z.
• Use the data from the table below to construct correctly labeled side-by-side graphs showing the production possibilities curve for Theo and Marlee. Assume that both have constant opportunity costs: Theo Marlee Bananas 20 50 Rice (in lbs.) 30 50 • Suppose that Theo and Marlee each spent half of their day making each good; Theo makes 10 bananas and 15 pounds of rice and Marlee makes 25 bananas and 25 pounds of rice. Show this point on the production possibilities curve of each person, and label that point X on your graph above. What is the total production of each good? • Suppose that Theo and Marlee agree to exchange 4 bananas for 5 pounds of rice. Under this agreement, Theo sells 15 pounds of his 30 pounds of rice to Marlee, in exchange for 12 of her 50 bananas. Show the new consumption points on the graph above for each person, and label these new consumption points Z.

Brief Principles of Macroeconomics (MindTap Course List)
8th Edition
ISBN:9781337091985
Author:N. Gregory Mankiw
Publisher:N. Gregory Mankiw
Chapter2: Thinking Like An Economist
Section: Chapter Questions
Problem 3PA

Related questions

Question
Transcribed Image Text:• Use the data from the table below to construct correctly labeled
side-by-side graphs showing the production possibilities curve for
Theo and Marlee. Assume that both have constant opportunity
costs:
Theo
Marlee
Bananas
20
50
Rice (in lbs.)
30
50
• Suppose that Theo and Marlee each spent half of their day
making each good; Theo makes 10 bananas and 15 pounds of
rice and Marlee makes 25 bananas and 25 pounds of rice. Show
this point on the production possibilities curve of each person,
and label that point X on your graph above. What is the total
production of each good?
• Suppose that Theo and Marlee agree to exchange 4 bananas for
5 pounds of rice. Under this agreement, Theo sells 15 pounds of
his 30 pounds of rice to Marlee, in exchange for 12 of her 50
bananas. Show the new consumption points on the graph above
for each person, and label these new consumption points Z.
Expert Solution
This question has been solved!
Explore an expertly crafted, step-by-step solution for a thorough understanding of key concepts.

This is a popular solution!

Trending now
This is a popular solution!

Step by step
Solved in 2 steps with 3 images

Knowledge Booster


Learn more about
Need a deep-dive on the concept behind this application? Look no further. Learn more about this topic, economics and related others by exploring similar questions and additional content below.Recommended textbooks for you
Brief Principles of Macroeconomics (MindTap Cours…
Economics
ISBN:
9781337091985
Author:
N. Gregory Mankiw
Publisher:
Cengage Learning


Essentials of Economics (MindTap Course List)
Economics
ISBN:
9781337091992
Author:
N. Gregory Mankiw
Publisher:
Cengage Learning
Brief Principles of Macroeconomics (MindTap Cours…
Economics
ISBN:
9781337091985
Author:
N. Gregory Mankiw
Publisher:
Cengage Learning
Essentials of Economics (MindTap Course List)
Economics
ISBN:
9781337091992
Author:
N. Gregory Mankiw
Publisher:
Cengage Learning