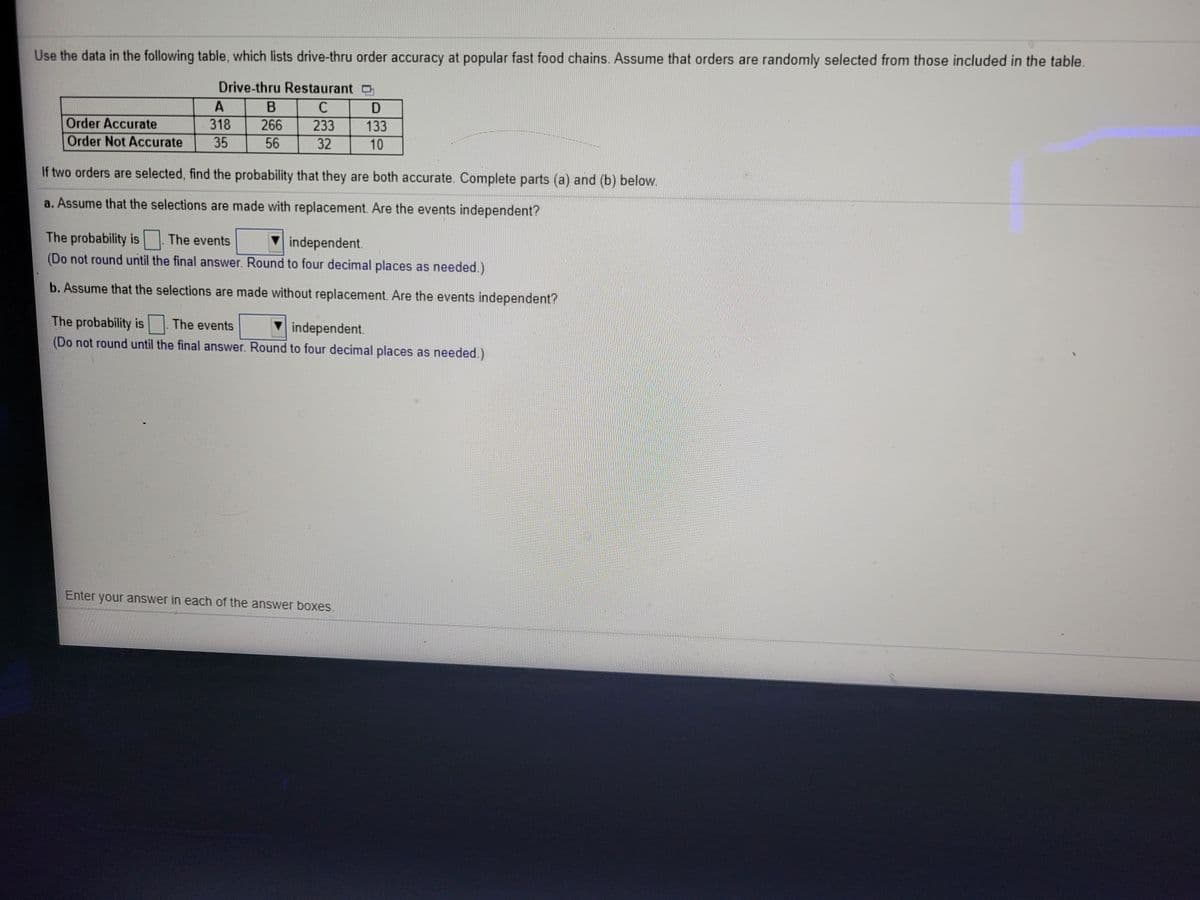
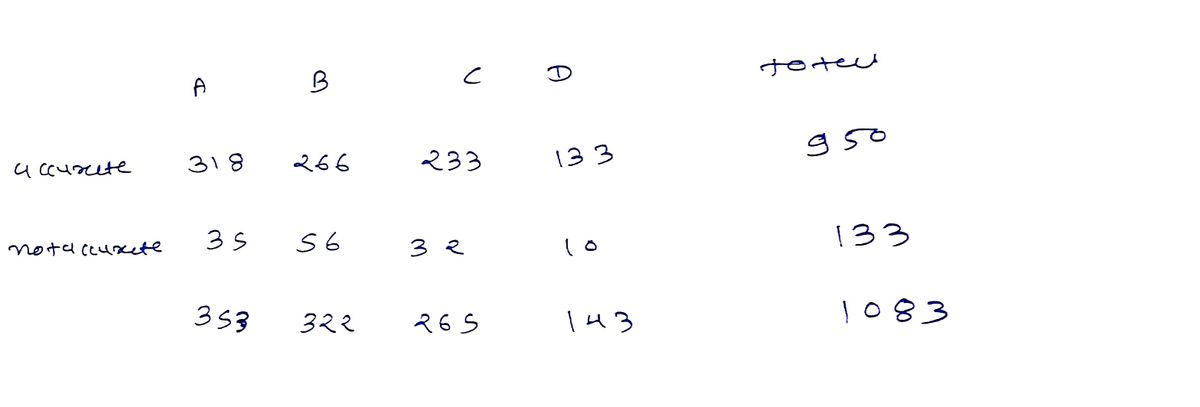
Use the data in the following table, which lists drive-thru order accuracy at popular fast food chains. Assume that orders are randomly selected from those included in the table. Drive-thru Restaurant o B 266 56 D Order Accurate Order Not Accurate 233 318 35 133 32 10 If two orders are selected, find the probability that they are both accurate. Complete parts (a) and (b) below. a. Assume that the selections are made with replacement. Are the events independent? The probability is The events (Do not round until the final answer. Round to four decimal places as needed.) V independent b. Assume that the selections are made without replacement. Are the events independent? The probability is The events (Do not round until the final answer. Round to four decimal places as needed.) V independent. Enter your answer in each of the answer boxes.
Use the data in the following table, which lists drive-thru order accuracy at popular fast food chains. Assume that orders are randomly selected from those included in the table. Drive-thru Restaurant o B 266 56 D Order Accurate Order Not Accurate 233 318 35 133 32 10 If two orders are selected, find the probability that they are both accurate. Complete parts (a) and (b) below. a. Assume that the selections are made with replacement. Are the events independent? The probability is The events (Do not round until the final answer. Round to four decimal places as needed.) V independent b. Assume that the selections are made without replacement. Are the events independent? The probability is The events (Do not round until the final answer. Round to four decimal places as needed.) V independent. Enter your answer in each of the answer boxes.

Chapter8: Sequences, Series,and Probability
Section8.7: Probability
Problem 4ECP: Show that the probability of drawing a club at random from a standard deck of 52 playing cards is...

Related questions

Concept explainers
Contingency Table
A contingency table can be defined as the visual representation of the relationship between two or more categorical variables that can be evaluated and registered. It is a categorical version of the scatterplot, which is used to investigate the linear relationship between two variables. A contingency table is indeed a type of frequency distribution table that displays two variables at the same time.
Binomial Distribution
Binomial is an algebraic expression of the sum or the difference of two terms. Before knowing about binomial distribution, we must know about the binomial theorem.
Topic Video
Question
Urgent
Transcribed Image Text:Use the data in the following table, which lists drive-thru order accuracy at popular fast food chains. Assume that orders are randomly selected from those included in the table.
Drive-thru Restaurant D
A
B
Order Accurate
318
266
233
133
Order Not Accurate
35
56
32
10
If two orders are selected, find the probability that they are both accurate. Complete parts (a) and (b) below.
a. Assume that the selections are made with replacement. Are the events independent?
The probability is The events
(Do not round until the final answer. Round to four decimal places as needed.)
V independent.
b. Assume that the selections are made without replacement. Are the events independent?
The probability is The events
independent.
(Do not round until the final answer. Round to four decimal places as needed.)
Enter your answer in each of the answer boxes.
Expert Solution
Step 1

Trending now
This is a popular solution!

Step by step
Solved in 2 steps with 2 images

Knowledge Booster


Learn more about
Need a deep-dive on the concept behind this application? Look no further. Learn more about this topic, statistics and related others by exploring similar questions and additional content below.Recommended textbooks for you