Use the data in the following table, which lists drive-thru order accuracy at popular fast food chains. Assume that orders are randomly selected from those included in the table. Drive-thru Restaurant O D Order Accurate Order Not Accurate 313 266 232 146 31 51 37 16 If one order is selected, find the probability of getting an order that is not accurate or is from Restaurant C. Are the events of selecting an order that is not accurate and selecting an order from Restaurant C disjoint events? The probability of getting an order from Restaurant C or an order that is not accurate is. (Round to three decimal places as needed.) Are the events of selecting an order from Restaurant C and selecting an inaccurate order disjoint events? The events V disjoint because it possible to pick an accurate order. pick an order from Restaurant A, B, or D. receive an inaccurate order from Restaurant C.
Use the data in the following table, which lists drive-thru order accuracy at popular fast food chains. Assume that orders are randomly selected from those included in the table. Drive-thru Restaurant O D Order Accurate Order Not Accurate 313 266 232 146 31 51 37 16 If one order is selected, find the probability of getting an order that is not accurate or is from Restaurant C. Are the events of selecting an order that is not accurate and selecting an order from Restaurant C disjoint events? The probability of getting an order from Restaurant C or an order that is not accurate is. (Round to three decimal places as needed.) Are the events of selecting an order from Restaurant C and selecting an inaccurate order disjoint events? The events V disjoint because it possible to pick an accurate order. pick an order from Restaurant A, B, or D. receive an inaccurate order from Restaurant C.

Chapter8: Sequences, Series,and Probability
Section8.7: Probability
Problem 4ECP: Show that the probability of drawing a club at random from a standard deck of 52 playing cards is...

Related questions

Concept explainers
Contingency Table
A contingency table can be defined as the visual representation of the relationship between two or more categorical variables that can be evaluated and registered. It is a categorical version of the scatterplot, which is used to investigate the linear relationship between two variables. A contingency table is indeed a type of frequency distribution table that displays two variables at the same time.
Binomial Distribution
Binomial is an algebraic expression of the sum or the difference of two terms. Before knowing about binomial distribution, we must know about the binomial theorem.
Topic Video
Question
32
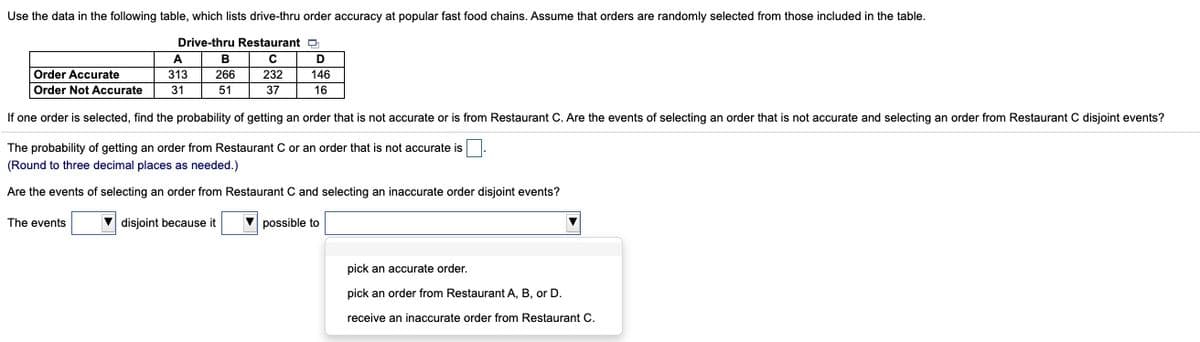
Transcribed Image Text:Use the data in the following table, which lists drive-thru order accuracy at popular fast food chains. Assume that orders are randomly selected from those included in the table.
Drive-thru Restaurant D
A
В
D
Order Accurate
313
266
232
146
Order Not Accurate
31
51
37
16
If one order is selected, find the probability of getting an order that is not accurate or is from Restaurant C. Are the events of selecting an order that is not accurate and selecting an order from Restaurant C disjoint events?
The probability of getting an order from Restaurant C or an order that is not accurate is
(Round to three decimal places as needed.)
Are the events of selecting an order from Restaurant C and selecting an inaccurate order disjoint events?
The events
V disjoint because it
possible to
pick an accurate order.
pick an order from Restaurant A, B, or D.
receive an inaccurate order from Restaurant C.
Expert Solution
This question has been solved!
Explore an expertly crafted, step-by-step solution for a thorough understanding of key concepts.

This is a popular solution!

Trending now
This is a popular solution!

Step by step
Solved in 4 steps with 4 images

Knowledge Booster


Learn more about
Need a deep-dive on the concept behind this application? Look no further. Learn more about this topic, statistics and related others by exploring similar questions and additional content below.Recommended textbooks for you

College Algebra
Algebra
ISBN:
9781305115545
Author:
James Stewart, Lothar Redlin, Saleem Watson
Publisher:
Cengage Learning

Holt Mcdougal Larson Pre-algebra: Student Edition…
Algebra
ISBN:
9780547587776
Author:
HOLT MCDOUGAL
Publisher:
HOLT MCDOUGAL
College Algebra
Algebra
ISBN:
9781305115545
Author:
James Stewart, Lothar Redlin, Saleem Watson
Publisher:
Cengage Learning
Holt Mcdougal Larson Pre-algebra: Student Edition…
Algebra
ISBN:
9780547587776
Author:
HOLT MCDOUGAL
Publisher:
HOLT MCDOUGAL

Algebra & Trigonometry with Analytic Geometry
Algebra
ISBN:
9781133382119
Author:
Swokowski
Publisher:
Cengage