Use the data in the table below for Questions A - D. Remember to show ALL your work. A high school teacher is interested in the number of text messages her students send during a one hour class. The following represents data collected from a group of 20 students from her class. 16 1 15 3 14 13 12 11 4 10 1 Copy the above frequency table into your assignment and complete the following questions: A. Calculate the median for these data. What is another name for the median? What is the percentile rank of X = 13? What is the percentile rank of X = 13 measuring in these data? В. C. the table above. Create a frequency distribution polygon to illustrate the data displayed in
Use the data in the table below for Questions A - D. Remember to show ALL your work. A high school teacher is interested in the number of text messages her students send during a one hour class. The following represents data collected from a group of 20 students from her class. 16 1 15 3 14 13 12 11 4 10 1 Copy the above frequency table into your assignment and complete the following questions: A. Calculate the median for these data. What is another name for the median? What is the percentile rank of X = 13? What is the percentile rank of X = 13 measuring in these data? В. C. the table above. Create a frequency distribution polygon to illustrate the data displayed in

Glencoe Algebra 1, Student Edition, 9780079039897, 0079039898, 2018
18th Edition
ISBN:9780079039897
Author:Carter
Publisher:Carter
Chapter10: Statistics
Section10.6: Summarizing Categorical Data
Problem 42PFA

Related questions
Question
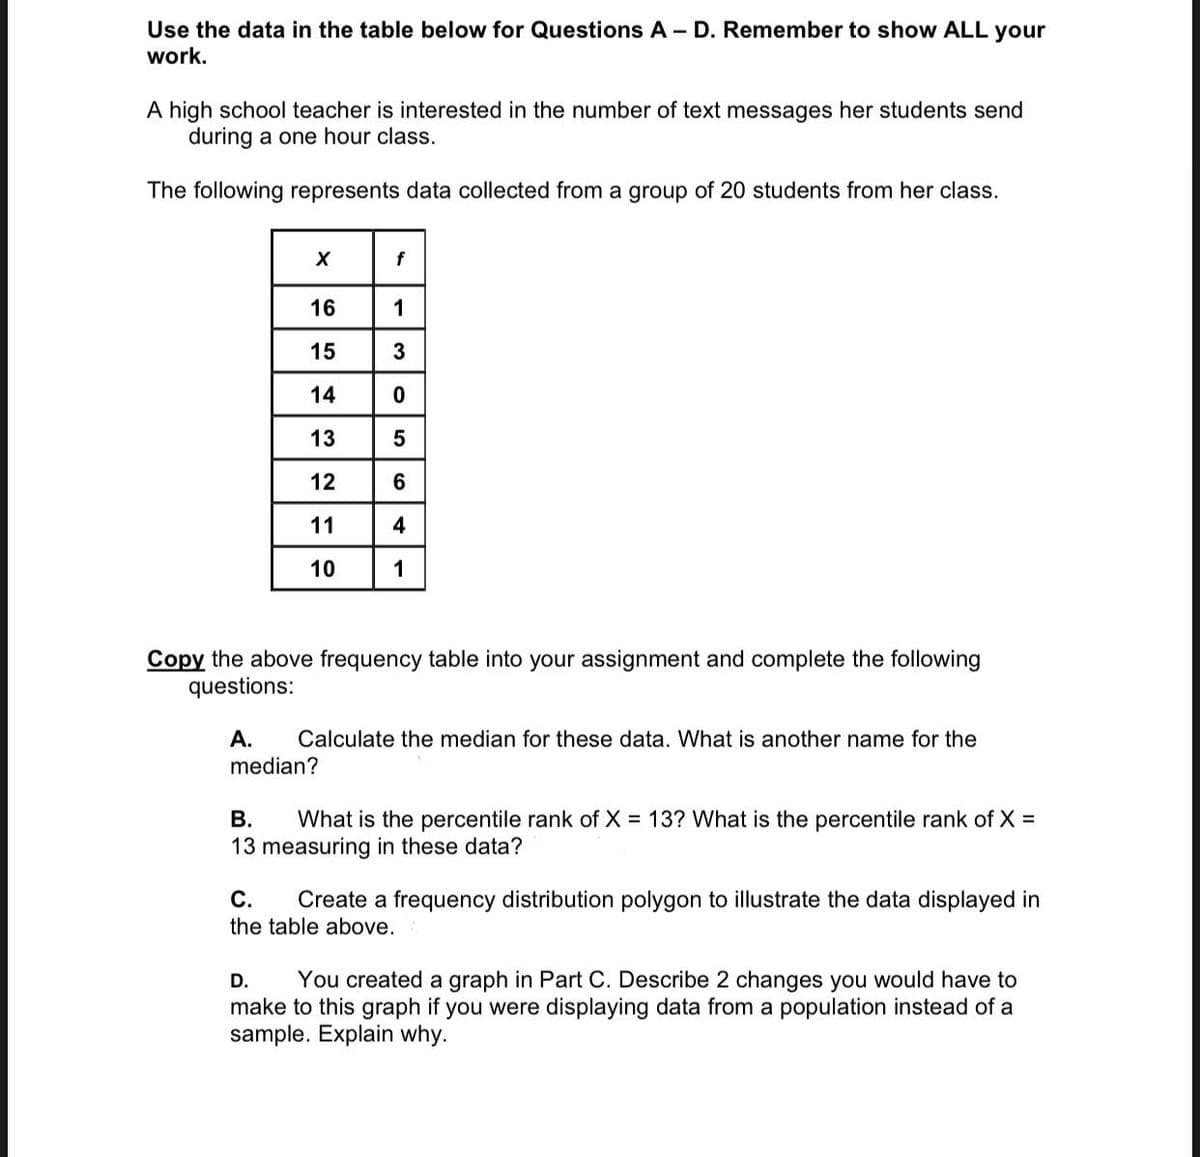
Transcribed Image Text:Use the data in the table below for Questions A - D. Remember to show ALL your
work.
A high school teacher is interested in the number of text messages her students send
during a one hour class.
The following represents data collected from a group of 20 students from her class.
16
1
15
3
14
13
12
6
4
1
Copy the above frequency table into your assignment and complete the following
questions:
А.
Calculate the median for these data. What is another name for the
median?
What is the percentile rank of X = 13? What is the percentile rank of X =
13 measuring in these data?
В.
С.
Create a frequency distribution polygon to illustrate the data displayed in
the table above.
D.
You created a graph in Part C. Describe 2 changes you would have to
make to this graph if you were displaying data from a population instead of a
sample. Explain why.
11
10
Expert Solution
This question has been solved!
Explore an expertly crafted, step-by-step solution for a thorough understanding of key concepts.

This is a popular solution!

Trending now
This is a popular solution!

Step by step
Solved in 4 steps with 1 images

Knowledge Booster


Learn more about
Need a deep-dive on the concept behind this application? Look no further. Learn more about this topic, statistics and related others by exploring similar questions and additional content below.Recommended textbooks for you
Glencoe Algebra 1, Student Edition, 9780079039897…
Algebra
ISBN:
9780079039897
Author:
Carter
Publisher:
McGraw Hill
Glencoe Algebra 1, Student Edition, 9780079039897…
Algebra
ISBN:
9780079039897
Author:
Carter
Publisher:
McGraw Hill