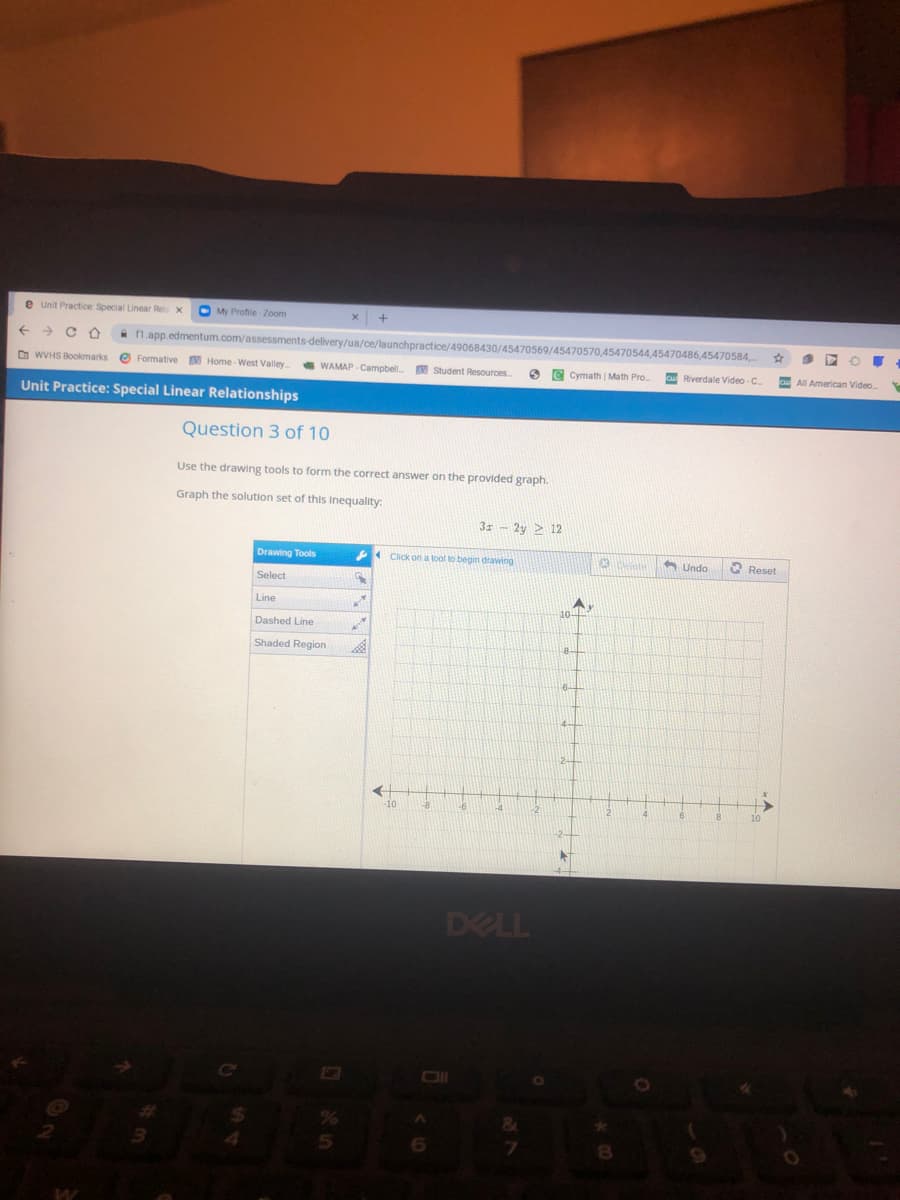
Use the drawing tools to form the correct answer on the provided graph. Graph the solution set of this inequality: 3z - 2y > 12 Drawing Tools Click on a tool to begin drawing Undo O Reset Select Line
Q: Select the values that make the inequality > -6 true. Then write an equivalent 2 inequality, in…
A:
Q: Sketch the graph of each linear inequality. 9) 3x - 2y< 10
A: The given inequality is 3x - 2y < 10
Q: write the inequality with the following boundary lines A) x+3y=3 B) y=x-2
A: Given equations We need to write the inequality of the given graph using the provided equation Use…
Q: Graph the solution set to the inequality. Label coordinates of all corner points (if any). -6x + y s…
A:
Q: Use a graphing calculator to graph the linear inequality. 3x - 2y ≥ 18
A: Isolate the y term on the left hand side of the inequality. This can be done by adding 2y and…
Q: Select the values that make the inequality 6w > -54 true. Then write an equivalent inequality, in…
A:
Q: Graph the inequality y > 1
A: To graph: The inequality:
Q: Graph the following linear inequality in two variables: 2x + y ≥ 5.
A:
Q: 4. For each inequality, decide whether the solution is represented by x 4.5. a. -24 > -6(x – 0.5)…
A:
Q: Y – 5x AI
A: Topic = Inequality
Q: For each ordered pair (x, y), determine whether it is a solution to the inequality x> -2. Is it a…
A: Please see the answer below.
Q: find the inequality shown by the following graph and then enter your inequality using the dropdown…
A: Disclaimer: Since you have asked multiple question, we will solve the first question for you. If you…
Q: On the set of axes below, graph the inequality 2x + y > 1.
A:
Q: Graph the following inequality. -5x+3y > -15
A: The given inequality is, -5x+3y>-15 Solving the inequality gives,
Q: 1 சு 0 UT
A:
Q: 5. y<-|3.x+ 9|+4 y
A:
Q: If you were to graph the below inequality, how would the line appear? y + 2y > 3y + 12x Select one:…
A:
Q: Use a graphing calculator to graph the linear inequality. 5x - 3y ≥ 15
A: Given : The linear inequality 5x - 3y ≥ 15 .
Q: Solve the inequality using a graphing utility : 1/(x + 1) ≤ 2/(x + 4)
A: 1x+1≤2x+4 The graph is,
Q: For each ordered pair (x, y), determine whether it is a solution to the inequality y2 3. Is it a…
A:
Q: Determine whether the ordered pair (3,2) is a solution to the inequality y≤3x+1 Check algebraically.
A:
Q: O Draw the graph of the inequality y > 3e*-1.
A: The function is a rule that associates or fixes a number to the particular point x. If , then the…
Q: Which one of the following points is the solution for the graph of inequality? Select one: O a.…
A: We see that the graph passing through (4,0) and (0,-4)
Q: Graph the following inequality. - 3x -3y > -3 Use the graphing tool to graph the inequality.
A:
Q: Graph the following inequality. 3x +y > 3 Use the graphing tool to graph the inequality.
A: Consider the given inequality
Q: Identify the best graph to fit the inequality. xy > 10
A:
Q: Determine whether the ordered pair (3,6) is a solution to the inequality y≤2/3 x+4 Check…
A:
Q: Select the values that make the inequality 9t < -45 true. Then write an equivalent inequality, in…
A:
Q: Graph the following inequality. - 3x + y > 6 Use the graphing tool to graph the inequality. Click to…
A: Explanation: Given inequality: -3x+y>6 Solve for y y>3x+6 To graph the inequality, we will…
Q: Graph the inequality. x+10y<0
A: Consider the given inequality. Replace the in-equality sign with equal to sign and name it as…
Q: Write an inequality for each graph. 1) ++ -7-6-54-3 3-2-1 0 i 2 3 5 67
A: Since you have posted multiple questions, as per our policy we will answer first question. Please…
Q: Sketch the graph of each linear inequality. 7 1) ys-x- 2 A) B) 4 2 D)
A: See the details solution in below
Q: Is the ordered pair a solution? Is the ordered pair a solution of the inequality? No 5x + y>4 Yes
A:
Q: Use a graphing calculator to graph the linear inequality. 4x + 3y ≤ 9
A: Here the given inequality is 4x+3y≤9 .....(1)
Q: Graph each inequality. 1.x ≥ 2 13 O 3.y = 3x +2 YAY 10 2. y<-2x Ľ y Ut 4. y<x+3/ YA 31
A: As per our guideline we are allowed to answer only three subparts of the given problem. Kindly…
Q: Is the ordered pair a solution? Is the ordered pair a solution of the inequality? No 5x + y>4 O Yes
A:
Q: Brenna scored a -2 on a computer game and wants to get a higher score next time. Graph an Inequality…
A: According to the question we should mark all the the possible score which is greater than - 2 So we…
Q: Choose the inequality that represents the following graph. + 1 2 3 4 -5 -4 -3 -2 -1 0
A:
Q: Graph the following inequality. y2x? -3
A:
Q: For each ordered pair (x, y), determine whether it is a solution to the inequality y 2-3. Is it a…
A:
Q: Which of the following inequality has a graph and solution as illustrated? A. 3x+4y≤9 B. 3x-4y≤9 C.…
A:
Q: Choose the inequality that represents the following graph. + 1 2 + 4 5 -5 -4 -3 -2 -1 Choose 1…
A:
Q: If you were to graph the below inequality, how would the line appear? y+ 2y > 3y + 12x
A: Option A is correct
Q: Graph the following inequality. 3x-y> 3 Use the graphing tool to graph the inequality.
A:
Q: Select all of the solutions for the linear inequality graphed below: A (0,-2) B (4, -1) C(-4, 0)…
A:
Q: Graph the linear inequality. ys - 6x
A: Given data: The given inequality is: y≤-6x. Convert the given inequality into equality. Draw…
Trending now
This is a popular solution!
Step by step
Solved in 2 steps with 2 images
- Interpret effect size t(30)=1.12, p=.34, n2=.001 small, medium, or largeSubject: Engineering Data Analysis For ungroup data: Kurtosis Skewness CV1.2 Using a students responses in Question 1, which student(s) selected a qualitative variable? A. Nonjabulo, Sibongile and Kyle B. Troy C. Troy and Jess D. Jess and Kyle 1.3 Using the students responses in Question 1, which student(s) selected a continuous variable? A. Troy and Khule B. Nonjabulo and Sibongile C. Khule and Kyle D. Sibongile and Kyle
- RESEARCH ANALYSIS AND PUBLICATION (LOB7) BATCH 27 An agent for a residential real estate company in a large city would like to be able to predict the monthly rental cost for apartments, based on the size of the apartments as defined by square footage. A sample of 14 apartments in a particular residential neighbourhood was selected, and the information gathered revealed the following: APARTMENT MONTHLY RENT ($) SIZE (SQUARE FEET) 1 950 850 2 1600 1450 3 1200 1085 4 1500 1232 5 950 718 6 1700 1485 7 1650 1136 8 935 726 9 875 700 10 1150 956 11 1400 1100 12 1650 1285 13 2300 1985 14 1800 1369 Do Normality Test and Linearity test, what did you find from these tests ? explainSamples are collected from the River X and pH values are observed. 9 different pH values are listed in table 3. Table 3 Concentrations 3.55 4.01 5.38 3.22 8.05 5.25 4.67 3.67 3.5Draw box plot and find a. Bowley’s coefficient of skewness b. Karl Pearson’s coefficient of skewness c. Third moment Rubric Stages of Process Marks Imagine and Plan 2Composition 2Effort 1Based on the data below, answer the following question: The variable "Full-Time Enrollment" is a ______ variable. Select one: a. continuous b. discrete Business School Full-Time Enrollment Students per Faculty Local Tuition ($) Foreign Tuitiion ($) English Test Work Experience Starting Salary ($) 1 Melbourne Business School 200 5 24,420 29,600 No Yes 71,400 2 University of New South Wales (Sydney) 228 4 19,993 32,582 No Yes 65,200 3 Indian Institute of Management (Ahmedabad) 392 5 4,300 4,300 No No 7,100 4 Chinese University of Hong Kong 90 5 11,140 11,140 No No 31,000 5 International University of Japan (Niigata) 126 4 33,060 33,060 Yes No 87,000 6 Asian Institute of Management (Manila) 389 5 7,562 9,000 No Yes 22,800 7 Indian Institute of Management (Bangalore) 380 5 3,935 16,000 No No 7,500 8 National University of Singapore 147 6 6,146 7,170 Yes Yes 43,300 9 Indian Institute of Management (Calcutta) 463 8 2,880 16,000 No No 7,400 10 Australian…
- Weekly sales of copy paper at Cubicle Suppliers are in the table below. Compute a three-period moving average and a four-period moving average for weeks 5, 6, and 7. Compute each forecast. Which model is more accurate? Forecast week 8 with the more accurate method. Week Sales (cases) 1 17 2 21 3 27 4 31 5 19 6 17 7 21Is the magnitude of an earthquake related to the depth below the surface at which the quake occurs? Let x be the magnitude of an earthquake (on the Richter scale), and let y be the depth (in kilometers) of the quake below the surface at the epicenter. x 2.8 3.9 3.3 4.5 2.6 3.2 3.4y 4.7 9.6 11.2 10.0 7.9 3.9 5.5(a) Make a scatter diagram of the data.Flash Player version 10 or higher is required for this question. You can get Flash Player free from Adobe's website. Then visualize the line you think best fits the data. (b) Use a calculator to verify that Σx = 23.7, Σx2 = 82.75, Σy = 52.8, Σy2 = 447.56 and Σxy = 184.28. Compute r. (Round to 3 decimal places.) As x increases, does the value of r imply that y should tend to increase or decrease? Explain your answer.Given our value of r, we can not draw any conclusions for the behavior of y as x increases.Given our value of r, y should tend to remain constant as x increases. Given our value of r, y should tend to decrease as x increases.Given…A city's transportation committee has conducted research on traffic and car accidents for downtown streets. There is a 9% chance of being involved in a car accident when 15 or more cars are driving on Johnson Street and a 7.5% chance when 20 or more cars are driving on Dublin Street. The two streets intersect to form a risk area with a radius of 0.1 mi. Approximate the density of cars per square mile in the risk area when 17 cars are on Johnson Street and 21 cars are on Dublin Street. Use 3.14 for pi. There are approximately 1,210 cars per square mile in the risk area. There are approximately 2,674 cars per square mile in the risk area. There are approximately 2,165 cars per square mile in the risk area. There are approximately 1,082 cars per square mile in the risk area.
- Cell Phone Radiation Listed below are the measured radiation absorption rates (in W/kg) corresponding to these cell phones: iPhone 5S, BlackBerry Z30, Sanyo Vero, Optimus V, Droid Razr, Nokia N97, Samsung Vibrant, Sony Z750a, Kyocera Kona, LG G2, and Virgin Mobile Supreme. The data are from the Federal Communications Commission (FCC). The media often report about the dangers of cell phone radiation as a cause of cancer. The FCC has a standard that a cell phone absorption rate must be 1.6 W/kg or less. If you are planning to purchase a cell phone, are any of the measures of center the most important statistic? Is there another statistic that is most relevant? If so, which one?Pricing Refrigerators. Best Buy, a nationwide retailer of electronics, computers, and appliances, sells several brands of refrigerators. A random sample of models of full size refrigerators prices sold by Best Buy and the corresponding cubic feet (cu.ft.) and list price follow (Best Buy website). Model Thru-the-Door Ice and Water? Cubic Feet List Price Frigidaire Gallery Custom-Flex Top-Freezer Refrigerator No 18.3 $899.99 GE French Door Refrigerator No 24.8 $1,599.99 GE Frost-Free Side-by-Side Refrigerator with Thru-the-Door Ice and Water Yes 25.4 $1,599.99 Whirlpool Top-Freezer Refrigerator No 19.3 $749.99 GE Frost-Free Top-Freezer No 17.5 $599.99 Whirlpool French Door Refrigerator with Thru-the-Door Ice and Water Yes 19.6 $1,619.99 Samsung French Door Refrigerator No 25.0 $999.99 Samsung Side-by-Side Refrigerator No 24.5 $1,299.99 Whirlpool Side-by-Side Refrigerator with Thru-the-Door Ice and Water Yes 25.4 $1,299.99 Frigidaire Gallery Frost-Free…A company sets different prices for a particular DVD system in eight differentregions of the country. Table 1 shows the numbers of units sold and thecorresponding unit prices (in U.S. Dollars).Table 1: Sales DataRegion Sales (Units) Price (U.S. Dollars)1 420 1042 380 1953 350 1484 400 2045 440 966 380 2567 450 1418 420 109You are given the following regression model:Salesi = 1 + 2Pricei + uiwhere i is region, Sales are number of units sold, Price is unit price inU.S. Dollars, and u is a random error term.Based on the data:1. Estimate the regression model. 2. Interpret the estimated regression equation. 3. Compute the standard errors of the estimated coefficients. 4. Test the statistical significance of 2 at the 5% level of significance.5. Compute R2 and interpret it.