Use the figure below to answer the questions that follow. The figure shows the results of a recent Marist poll asking about President Biden’s approval rating. The range of the confidence interval for these data points is 4.3%. For example, the first row shows that among all adults in the nations, 42% approve of Biden’s work. This means that confidence intervals for this result would be approximately (38, 46). ** see image attached The figure shows that people with less income are more likely to approve of Biden’s work than people with higher income. Is this result statistically significant given the width of the confidence interval? Explain. 2. The figure shows that people with more education are more likely to approve of Biden’s work than people with less education. Is this result statistically significant given the width of the confidence interval? Explain.
Use the figure below to answer the questions that follow. The figure shows the results of a recent Marist poll asking about President Biden’s approval rating. The range of the confidence interval for these data points is 4.3%. For example, the first row shows that among all adults in the nations, 42% approve of Biden’s work. This means that confidence intervals for this result would be approximately (38, 46). ** see image attached The figure shows that people with less income are more likely to approve of Biden’s work than people with higher income. Is this result statistically significant given the width of the confidence interval? Explain. 2. The figure shows that people with more education are more likely to approve of Biden’s work than people with less education. Is this result statistically significant given the width of the confidence interval? Explain.

Algebra & Trigonometry with Analytic Geometry
13th Edition
ISBN:9781133382119
Author:Swokowski
Publisher:Swokowski
Chapter7: Analytic Trigonometry
Section7.3: The Addition And Subtraction Formulas
Problem 76E

Related questions
Question
100%
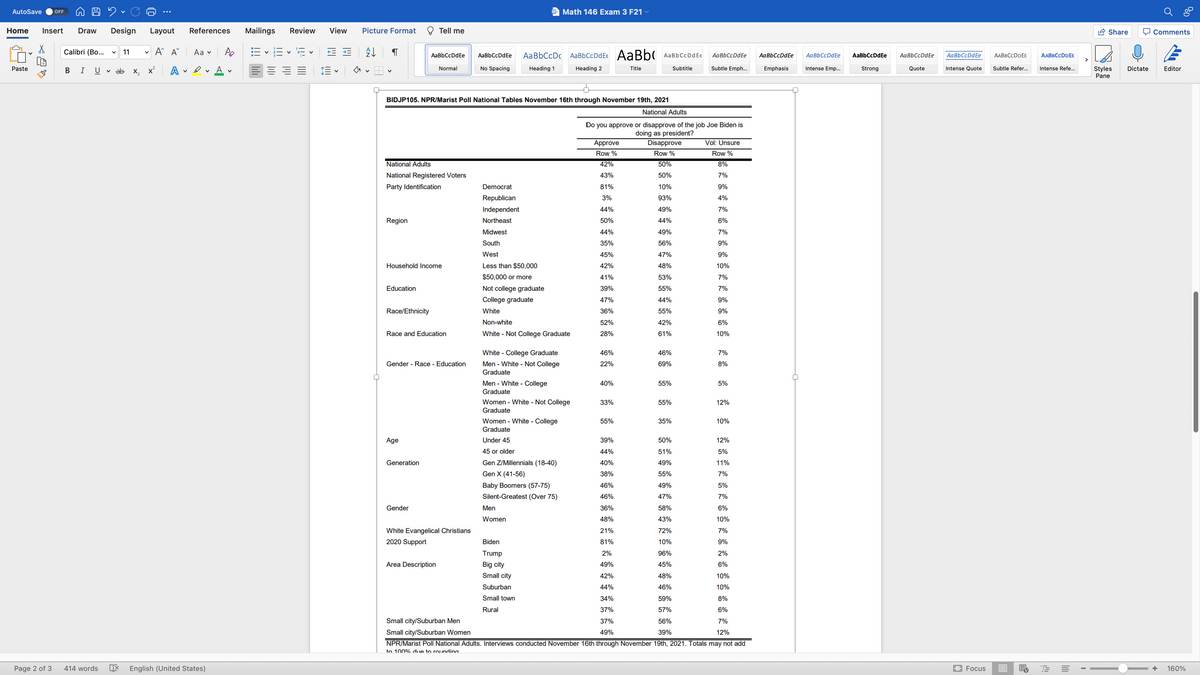
- Use the figure below to answer the questions that follow. The figure shows the results of a recent Marist poll asking about President Biden’s approval rating. The
range of the confidence interval for these data points is 4.3%. For example, the first row shows that among all adults in the nations, 42% approve of Biden’s work. This means that confidence intervals for this result would be approximately (38, 46).
** see image attached
- The figure shows that people with less income are more likely to approve of Biden’s work than people with higher income. Is this result statistically significant given the width of the confidence interval? Explain.
2. The figure shows that people with more education are more likely to approve of Biden’s work than people with less education. Is this result statistically significant given the width of the confidence interval? Explain.
Transcribed Image Text:AutoSave
w- Math 146 Exam 3 F21~
OFF
Home
Insert
Draw
Design
Layout
References
Mailings
Review
View
Picture Format
Tell me
A Share
Comments
Calibri (Bo...
A A
Аa v
E vE v E v E E
11
AaBbCcDc
AaBbCcDdEe AaBb
AaBbCcDdEe
AaBbCcDdEe
AaBbCcDdEe
AаBbСcDdEe
AаBbСcDdEe
AaBbCcDdEe
AaBbCcDdEe
AaBbCcDdEe
AаBЬСcDdEe
AABBCCDDEE
AABBCCDDEE
>
E = = =
x
A
No Spacing
Heading 1
Title
Subtitle
Subtle Emph...
Emphasis
Intense Emp..
Styles
Dictate
Paste
I
U
v ab X,
A
Normal
Heading 2
Strong
Quote
Intense Quote
Subtle Refer...
Intense Refe...
Editor
Pane
BIDJP105. NPR/Marist Poll National Tables November 16th through November 19th, 2021
National Adults
Do you approve or disapprove of the job Joe Biden is
doing as president?
Disapprove
Approve
Vol: Unsure
Row %
Row %
Row %
National Adults
42%
50%
8%
National Registered Voters
43%
50%
7%
Party Identification
Democrat
81%
10%
9%
Republican
3%
93%
4%
Independent
44%
49%
7%
Region
Northeast
50%
44%
6%
Midwest
44%
49%
7%
South
35%
56%
9%
West
45%
47%
9%
Household Income
Less than $50,000
42%
48%
10%
$50,000 or more
41%
53%
7%
Education
Not college graduate
39%
55%
7%
College graduate
47%
44%
9%
Race/Ethnicity
White
36%
55%
9%
Non-white
52%
42%
6%
Race and Education
White - Not College Graduate
28%
61%
10%
White - College Graduate
46%
46%
7%
Gender - Race - Education
Men - White - Not College
22%
69%
8%
Graduate
Men - White - College
40%
55%
5%
Graduate
Women - White - Not College
Graduate
33%
55%
12%
Women - White - College
55%
35%
10%
Graduate
Age
Under 45
39%
50%
12%
45 or older
44%
51%
5%
Generation
Gen Z/Millennials (18-40)
40%
49%
11%
Gen X (41-56)
38%
55%
7%
Baby Boomers (57-75)
46%
49%
5%
Silent-Greatest (Over 75)
46%
47%
7%
Gender
Men
36%
58%
6%
Women
48%
43%
10%
White Evangelical Christians
2020 Support
21%
72%
7%
Biden
81%
10%
9%
Trump
2%
96%
2%
Area Description
Big city
49%
45%
6%
Small city
42%
48%
10%
Suburban
44%
46%
10%
Small town
34%
59%
8%
Rural
37%
57%
6%
Small city/Suburban Men
37%
56%
7%
Small city/Suburban Women
49%
39%
12%
NPR/Marist Poll National Adults. Interviews conducted November 16th through November 19th, 2021. Totals may not add
to 100% due to roundina.
Page 2 of 3
414 words
E English (United States)
Focus
160%
+
Expert Solution
This question has been solved!
Explore an expertly crafted, step-by-step solution for a thorough understanding of key concepts.

This is a popular solution!

Trending now
This is a popular solution!

Step by step
Solved in 3 steps

Recommended textbooks for you
Algebra & Trigonometry with Analytic Geometry
Algebra
ISBN:
9781133382119
Author:
Swokowski
Publisher:
Cengage

Linear Algebra: A Modern Introduction
Algebra
ISBN:
9781285463247
Author:
David Poole
Publisher:
Cengage Learning

Big Ideas Math A Bridge To Success Algebra 1: Stu…
Algebra
ISBN:
9781680331141
Author:
HOUGHTON MIFFLIN HARCOURT
Publisher:
Houghton Mifflin Harcourt
Algebra & Trigonometry with Analytic Geometry
Algebra
ISBN:
9781133382119
Author:
Swokowski
Publisher:
Cengage
Linear Algebra: A Modern Introduction
Algebra
ISBN:
9781285463247
Author:
David Poole
Publisher:
Cengage Learning
Big Ideas Math A Bridge To Success Algebra 1: Stu…
Algebra
ISBN:
9781680331141
Author:
HOUGHTON MIFFLIN HARCOURT
Publisher:
Houghton Mifflin Harcourt