Use the following information from a multiple regression analysis to complete parts (a) through (c) below. Choose the correct hypotheses for X₂ below. OA. Ho: B₂ = 1 H₁: B₂ #1 OC. Ho: B₂ #0 H₁: B₂ = 0 Find the test statistic. (Round to two decimal places as needed.) Find the p-value. (Round to three decimal places as needed.) O B. Ho: B2#1 H₁: B₂ = 1 O D. Ho: B₂ = 0 H₁: B₂ #0 Is there evidence that the variable X. contributes to a model already containing X.?
Use the following information from a multiple regression analysis to complete parts (a) through (c) below. Choose the correct hypotheses for X₂ below. OA. Ho: B₂ = 1 H₁: B₂ #1 OC. Ho: B₂ #0 H₁: B₂ = 0 Find the test statistic. (Round to two decimal places as needed.) Find the p-value. (Round to three decimal places as needed.) O B. Ho: B2#1 H₁: B₂ = 1 O D. Ho: B₂ = 0 H₁: B₂ #0 Is there evidence that the variable X. contributes to a model already containing X.?

College Algebra
7th Edition
ISBN:9781305115545
Author:James Stewart, Lothar Redlin, Saleem Watson
Publisher:James Stewart, Lothar Redlin, Saleem Watson
Chapter1: Equations And Graphs
Section: Chapter Questions
Problem 10T: Olympic Pole Vault The graph in Figure 7 indicates that in recent years the winning Olympic men’s...

Related questions
Question
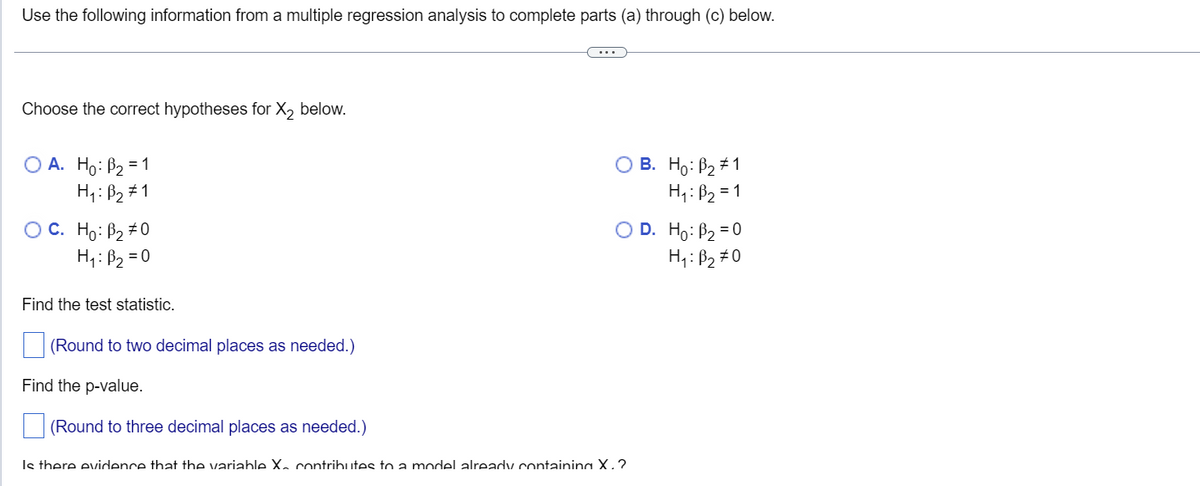
Transcribed Image Text:Use the following information from a multiple regression analysis to complete parts (a) through (c) below.
Choose the correct hypotheses for X₂ below.
OA. Ho: B₂ = 1
H₁: B₂ #1
OC. Ho: B₂ #0
H₁: B₂=0
Find the test statistic.
(Round to two decimal places as needed.)
Find the p-value
(Round to three decimal places as needed.)
O B. Ho: B2#1
H₁: B₂ = 1
O D. Ho: B₂ = 0
H₁: B₂ #0
Is there evidence that the variable X. contributes a model already containing X.?
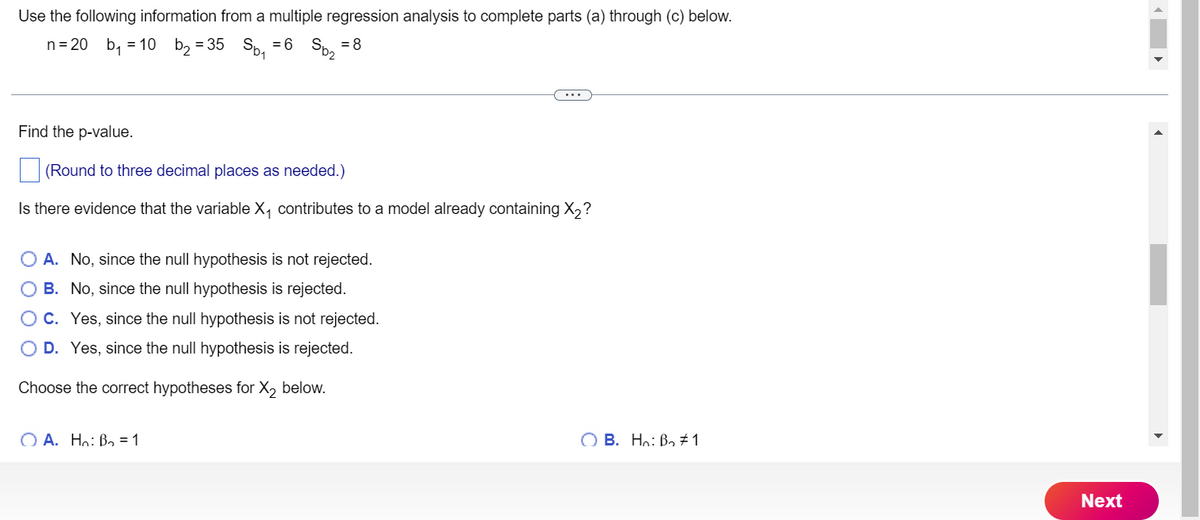
Transcribed Image Text:Use the following information from a multiple regression analysis to complete parts (a) through (c) below.
n = 20 b₁ = 10 b₂ = 35 Sb₁ = 6
= 8
Sp₂
Find the p-value.
(Round to three decimal places as needed.)
Is there evidence that the variable X₁ contributes to a model already containing X₂?
O A. No, since the null hypothesis is not rejected.
O B.
No, since the null hypothesis is rejected.
O C.
Yes, since the null hypothesis is not rejected.
D. Yes, since the null hypothesis is rejected.
Choose the correct hypotheses for X₂ below.
OA. Ho: B₂ = 1
OB. Ho: B₂ #1
Next
Expert Solution
This question has been solved!
Explore an expertly crafted, step-by-step solution for a thorough understanding of key concepts.

Step by step
Solved in 2 steps with 2 images

Recommended textbooks for you
College Algebra
Algebra
ISBN:
9781305115545
Author:
James Stewart, Lothar Redlin, Saleem Watson
Publisher:
Cengage Learning

Functions and Change: A Modeling Approach to Coll…
Algebra
ISBN:
9781337111348
Author:
Bruce Crauder, Benny Evans, Alan Noell
Publisher:
Cengage Learning
College Algebra
Algebra
ISBN:
9781305115545
Author:
James Stewart, Lothar Redlin, Saleem Watson
Publisher:
Cengage Learning
Functions and Change: A Modeling Approach to Coll…
Algebra
ISBN:
9781337111348
Author:
Bruce Crauder, Benny Evans, Alan Noell
Publisher:
Cengage Learning