
Macroeconomics: Principles and Policy (MindTap Course List)
13th Edition
ISBN:9781305280601
Author:William J. Baumol, Alan S. Blinder
Publisher:William J. Baumol, Alan S. Blinder
Chapter8: Aggregate Demand And The Powerful Consumer
Section: Chapter Questions
Problem 8DQ

Related questions
Question
! plz solved all parts for a like..
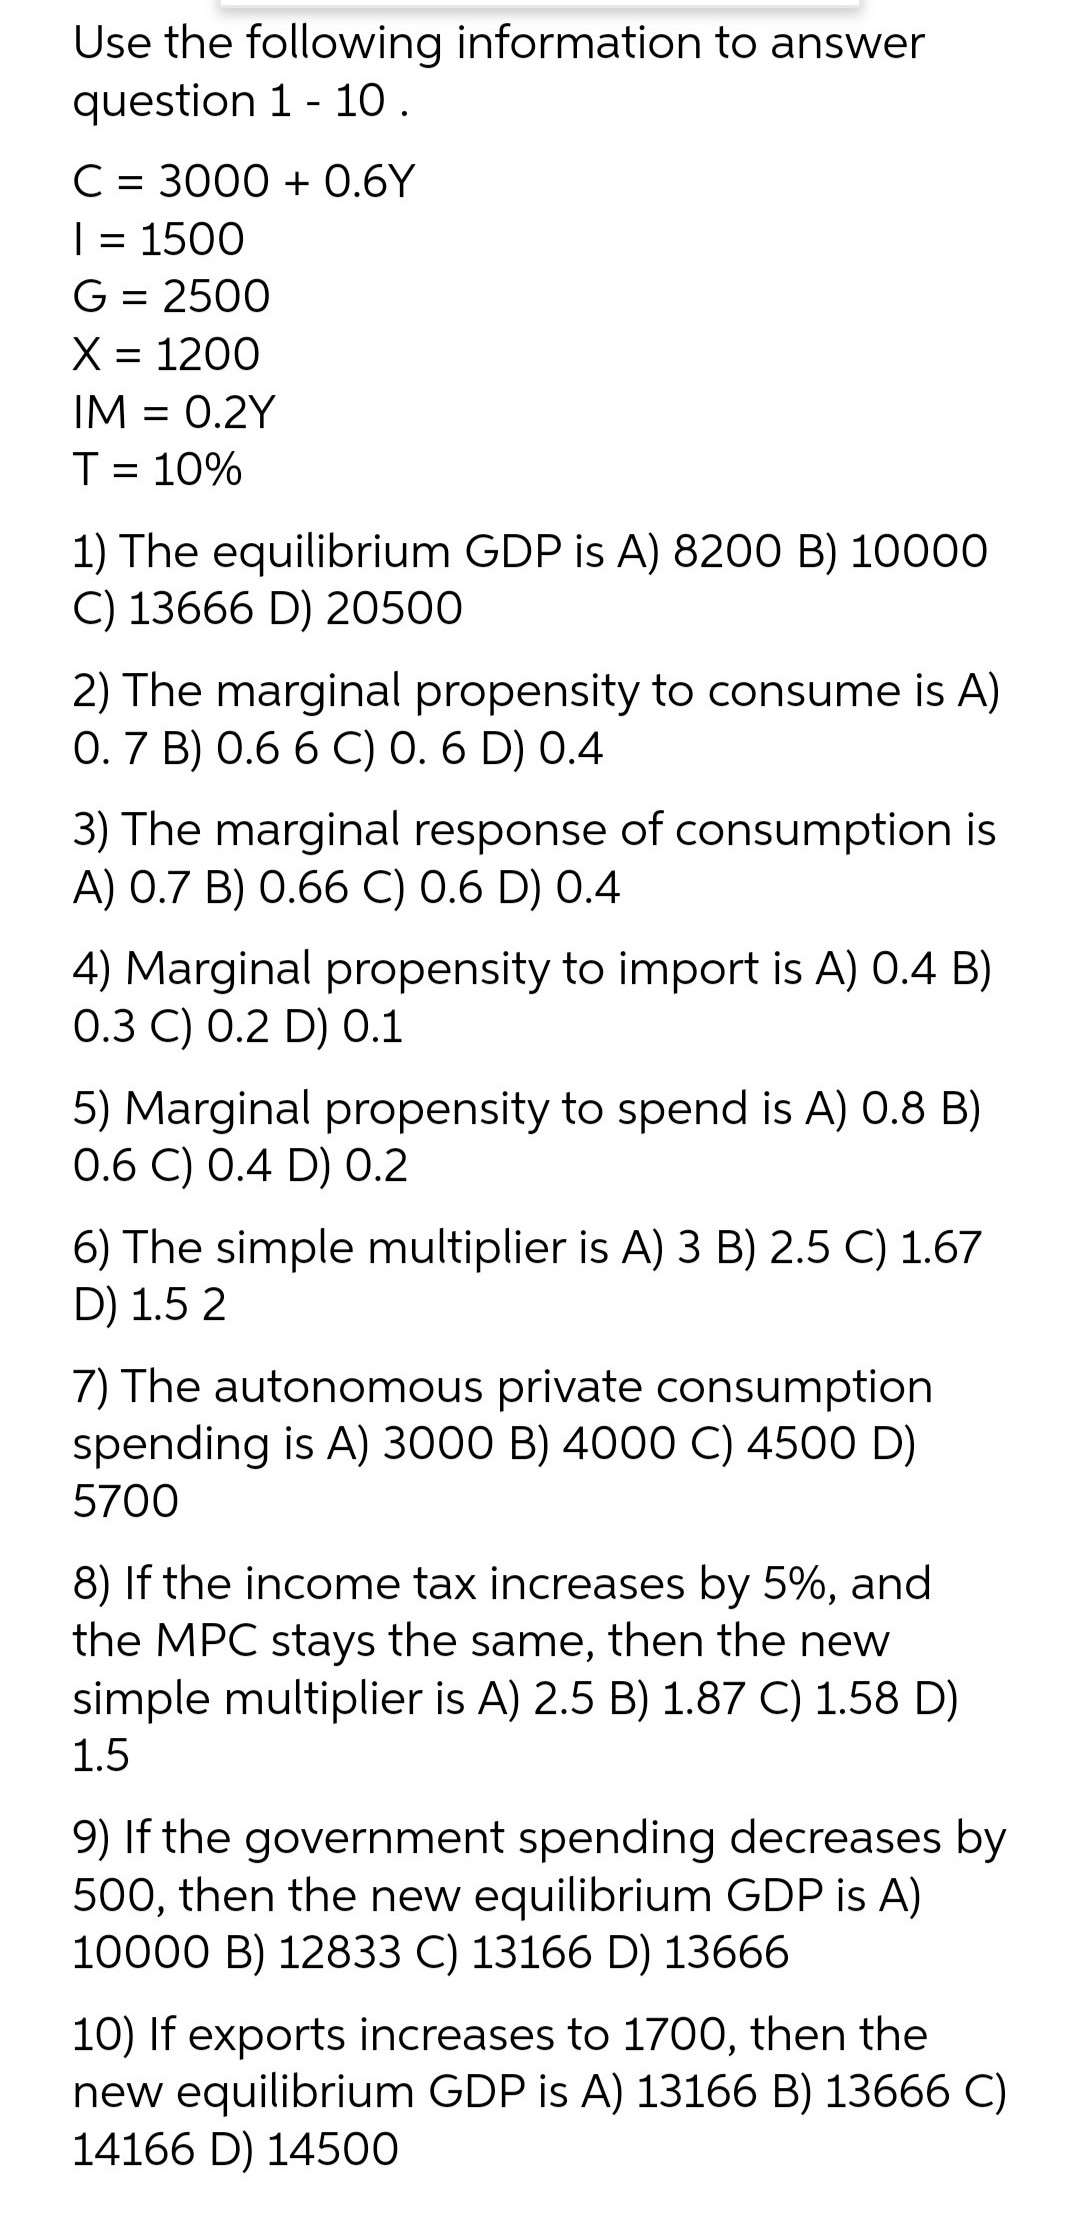
Transcribed Image Text:Use the following information to answer
question 1 - 10 .
C = 3000 + 0.6Y
| = 1500
G = 2500
X = 1200
IM = 0.2Y
T = 10%
1) The equilibrium GDP is A) 8200 B) 10000
C) 13666 D) 20500
2) The marginal propensity to consume is A)
0.7 B) 0.6 6 C) 0. 6 D) 0.4
3) The marginal response of consumption is
A) 0.7 B) 0.66 C) 0.6 D) 0.4
4) Marginal propensity to import is A) 0.4 B)
О.3 С) 0.2 D) 0.1
5) Marginal propensity to spend is A) 0.8 B)
0.6 C) 0.4 D) 0.2
6) The simple multiplier is A) 3 B) 2.5 C) 1.67
D) 1.5 2
7) The autonomous private consumption
spending is A) 3000 B) 4000 C) 4500 D)
5700
8) If the income tax increases by 5%, and
the MPC stays the same, then the new
simple multiplier is A) 2.5 B) 1.87 C) 1.58 D)
1.5
9) If the government spending decreases by
500, then the new equilibrium GDP is A)
10000 B) 12833 C) 13166 D) 13666
10) If exports increases to 1700, then the
new equilibrium GDP is A) 13166 B) 13666 C)
14166 D) 14500
Expert Solution
This question has been solved!
Explore an expertly crafted, step-by-step solution for a thorough understanding of key concepts.

This is a popular solution!

Trending now
This is a popular solution!

Step by step
Solved in 7 steps

Recommended textbooks for you
Macroeconomics: Principles and Policy (MindTap Co…
Economics
ISBN:
9781305280601
Author:
William J. Baumol, Alan S. Blinder
Publisher:
Cengage Learning
Macroeconomics: Principles and Policy (MindTap Co…
Economics
ISBN:
9781305280601
Author:
William J. Baumol, Alan S. Blinder
Publisher:
Cengage Learning