Use the following unit normal tables and accompanying figures to determine the probability that a z-score value will fall within each of the specified ranges. To use the tables, click on the Unit Normal Tables tab beneath the figures, and use the dropdown box to select the desired range of z-score values. A table of the proportions of the normal distribution corresponding to that range of z-scores will appear. If you need a different range of z- scores, simply dick on the box again and select a new range. Suggestion: For each of the following five questions, make a sketch of the area under the normal distribution you are seeking. This sketch will help you determine which column(s) of the unit normal tables to use in determining the appropriate probability. 1. p(z > 2.1) 2. p(2 > -1.7) 3. p(z < 1.6) 4. p(0.3
Use the following unit normal tables and accompanying figures to determine the probability that a z-score value will fall within each of the specified ranges. To use the tables, click on the Unit Normal Tables tab beneath the figures, and use the dropdown box to select the desired range of z-score values. A table of the proportions of the normal distribution corresponding to that range of z-scores will appear. If you need a different range of z- scores, simply dick on the box again and select a new range. Suggestion: For each of the following five questions, make a sketch of the area under the normal distribution you are seeking. This sketch will help you determine which column(s) of the unit normal tables to use in determining the appropriate probability. 1. p(z > 2.1) 2. p(2 > -1.7) 3. p(z < 1.6) 4. p(0.3

Glencoe Algebra 1, Student Edition, 9780079039897, 0079039898, 2018
18th Edition
ISBN:9780079039897
Author:Carter
Publisher:Carter
Chapter10: Statistics
Section10.4: Distributions Of Data
Problem 19PFA

Related questions
Question
fill blanks
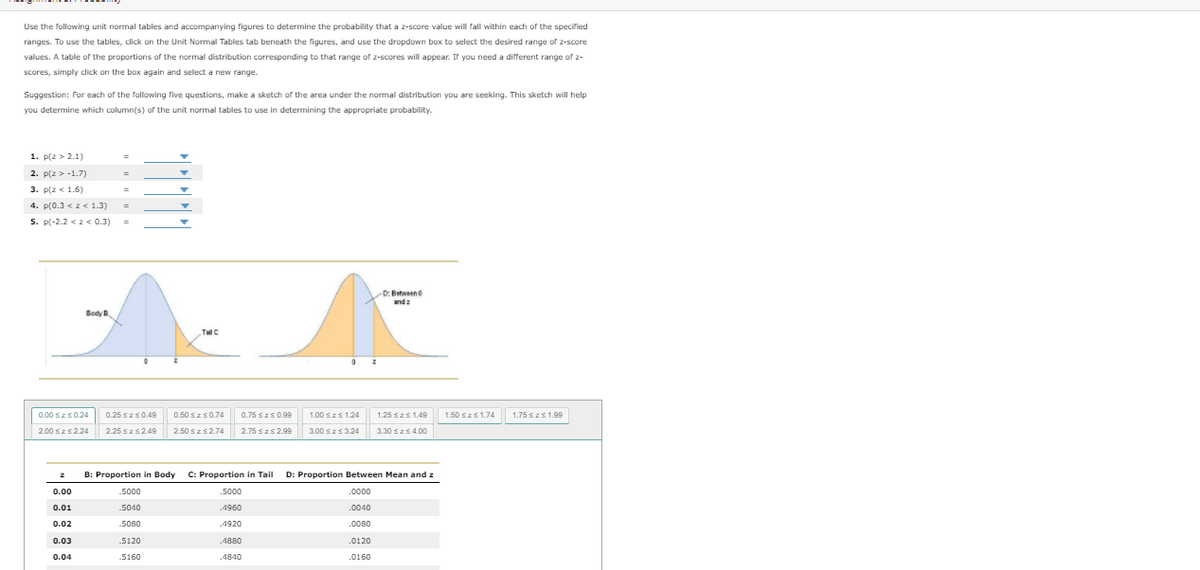
Transcribed Image Text:Use the following unit normal tables and accompanying figures to determine the probability that a z-score value will fall within each of the specified
ranges. To use the tables, click on the Unit Normal Tables tab beneath the figures, and use the dropdown box to select the desired range of 2-score
values. A table of the proportions of the normal distribution corresponding to that range of z-scores will appear. If you need a different range of z-
scores, simply dlick on the box again and select a new range.
Suggestion: For each of the following five questions, make a sketch of the area under the normal distribution you are seeking. This sketch will help
you determine which column(s) of the unit normal tables to use in determining the appropriate probability.
1. p(2 > 2.1)
2. p(z > -1.7)
3. p(z < 1.6)
4. p(0.3 <z< 1.3)
5. p(-2.2 < z < 0.3)
D: Between o
and z
BodyB
Tal C
0.00 szs0.24
0.25 szs0.49
0.50 szs0.74
0.75 szs0.99
1.00 szs 1.24
1.25 szs 1.49
1.50 szs 1.74
1.75 szs1.99
2.25 szs2.49
2.50 szs2.74
2.75 szs 2.99
3.00 szs 3.24
2.00 szs2.24
3.30 szs 4.00
B: Proportion in Body
C: Proportion in Tail
D: Proportion Between Mean and z
0.00
.5000
5000
.0000
0.01
5040
.4960
.0040
0.02
.5080
.4920
.0080
0.03
.5120
.4880
.0120
0.04
.5160
.4840
.0160
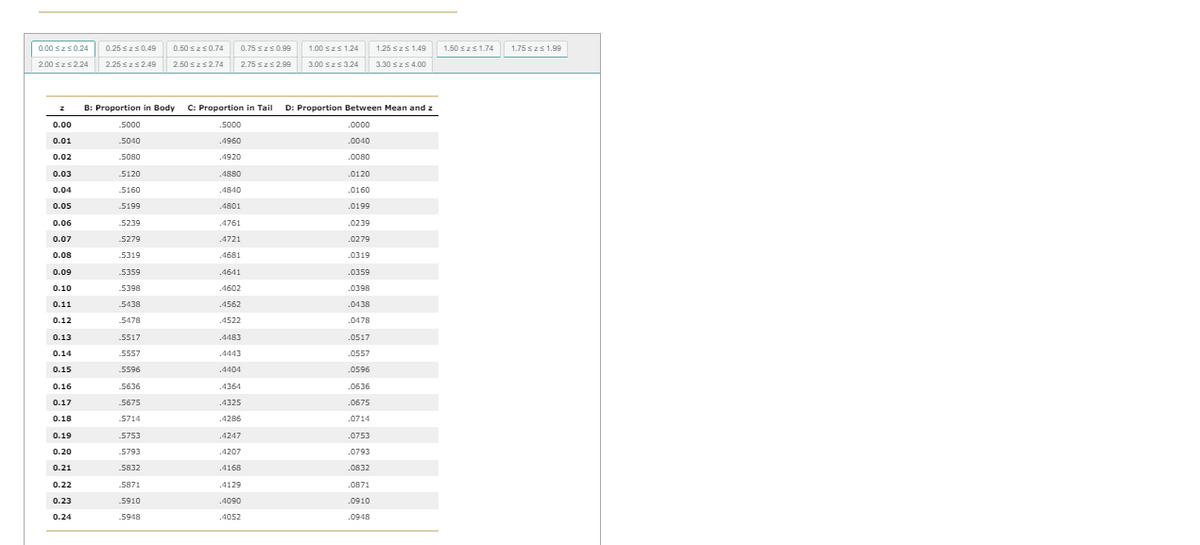
Transcribed Image Text:0.00 szs0.24
0.25 szs0.49
0.50 szs0.74
0.75 szs0.99
1.00 szs 1.24
1.25 szs 1.49
1.50 szs 1.74
1.75 szs1.99
2.00 szs2.24
2.25 szs2.49
2.50 szs2.74
2.75 szs 2.99
3.00 szs 3.24
3.30 szs 4.00
B: Proportion in Body
C: Proportion in Tail D: Proportion Between Mean and z
0.00
5000
5000
.0000
0.01
.5040
4960
.0040
0.02
5080
.4920
.0080
0.03
.5120
.4880
.0120
0.04
.5160
.4840
.0160
0.05
.5199
.4801
.0199
0.06
.5239
.4761
.0239
0.07
.5279
.4721
.0279
0.08
.5319
.4681
.0319
0.09
.5359
.4641
.0359
0.10
5398
.4602
.0398
0.11
.5438
.4562
.0438
0.12
.5478
.4522
.0478
0.13
.5517
.4483
.0517
0.14
.5557
.4443
.0557
0.15
.5596
.4404
.0596
0.16
5636
.4364
.0636
0.17
.5675
.4325
.0675
0.18
5714
.4286
.0714
0.19
.5753
.4247
.0753
0.20
.5793
.4207
.0793
0.21
5832
.4168
.0832
0.22
5871
.4129
.0871
0.23
.5910
4090
.0910
0.24
5948
.4052
.0948
Expert Solution
This question has been solved!
Explore an expertly crafted, step-by-step solution for a thorough understanding of key concepts.

This is a popular solution!

Trending now
This is a popular solution!

Step by step
Solved in 2 steps with 1 images

Recommended textbooks for you
Glencoe Algebra 1, Student Edition, 9780079039897…
Algebra
ISBN:
9780079039897
Author:
Carter
Publisher:
McGraw Hill
Glencoe Algebra 1, Student Edition, 9780079039897…
Algebra
ISBN:
9780079039897
Author:
Carter
Publisher:
McGraw Hill