Use the given data set to complete parts. (a) through (c) below. (Use α = 0.05.) X y 10 9.14 O A. Ay 8 8.14 Click here to view a table of critical values for the correlation coefficient. a. Construct a scatterplot. Choose the correct graph below. 10- 8- 6 4- 2- 0- 0 4 8 12 16 60000 13 8.73 Q E O B. Ay 10+ 84 9 8.76 6- 4- 2- 0+ 0 0000 88 4 8 12 16 Q Q 11 9.27 14 8.09 *** O C. A 6 6.13 10- 8- 6- 4- 2- 0- 0 4 8 12 16 Q 4 3.09 12 9.12 O D. Ay 10- 8- 6- 4 2- 0- 0 + Fut → . 4 8 b. Find the linear correlation coefficient, r, then determine whether there is sufficient evidence to support the claim of a linear correlation between the two variables. The linear correlation coefficient is r= (Round to three decimal places as needed.) 7 7.26 12 16 Q Q 5 5 4.75 Using the linear correlation coefficient found in the previous step, determine whether there is sufficient evidence to support the claim of a linear correlation between the two variables. Choose the correct answer below. E
Use the given data set to complete parts. (a) through (c) below. (Use α = 0.05.) X y 10 9.14 O A. Ay 8 8.14 Click here to view a table of critical values for the correlation coefficient. a. Construct a scatterplot. Choose the correct graph below. 10- 8- 6 4- 2- 0- 0 4 8 12 16 60000 13 8.73 Q E O B. Ay 10+ 84 9 8.76 6- 4- 2- 0+ 0 0000 88 4 8 12 16 Q Q 11 9.27 14 8.09 *** O C. A 6 6.13 10- 8- 6- 4- 2- 0- 0 4 8 12 16 Q 4 3.09 12 9.12 O D. Ay 10- 8- 6- 4 2- 0- 0 + Fut → . 4 8 b. Find the linear correlation coefficient, r, then determine whether there is sufficient evidence to support the claim of a linear correlation between the two variables. The linear correlation coefficient is r= (Round to three decimal places as needed.) 7 7.26 12 16 Q Q 5 5 4.75 Using the linear correlation coefficient found in the previous step, determine whether there is sufficient evidence to support the claim of a linear correlation between the two variables. Choose the correct answer below. E

Algebra & Trigonometry with Analytic Geometry
13th Edition
ISBN:9781133382119
Author:Swokowski
Publisher:Swokowski
Chapter3: Functions And Graphs
Section3.3: Lines
Problem 74E

Related questions
Question
Transcribed Image Text:K
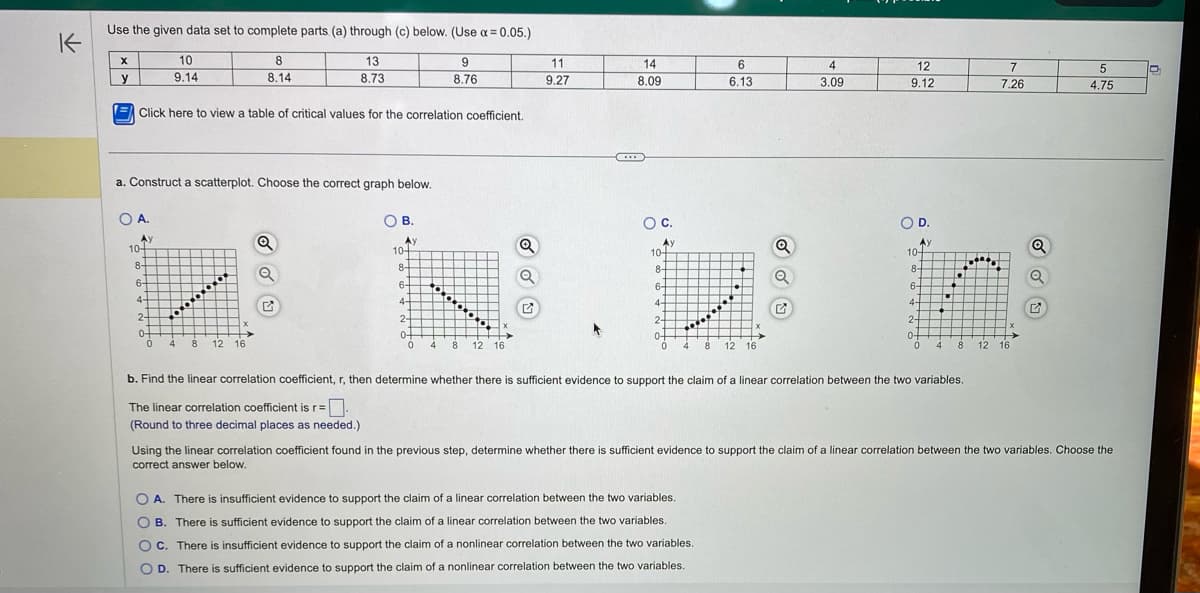
Use the given data set to complete parts. (a) through (c) below. (Use α = 0.05.)
8
9
13
8.73
8.14
8.76
X
y
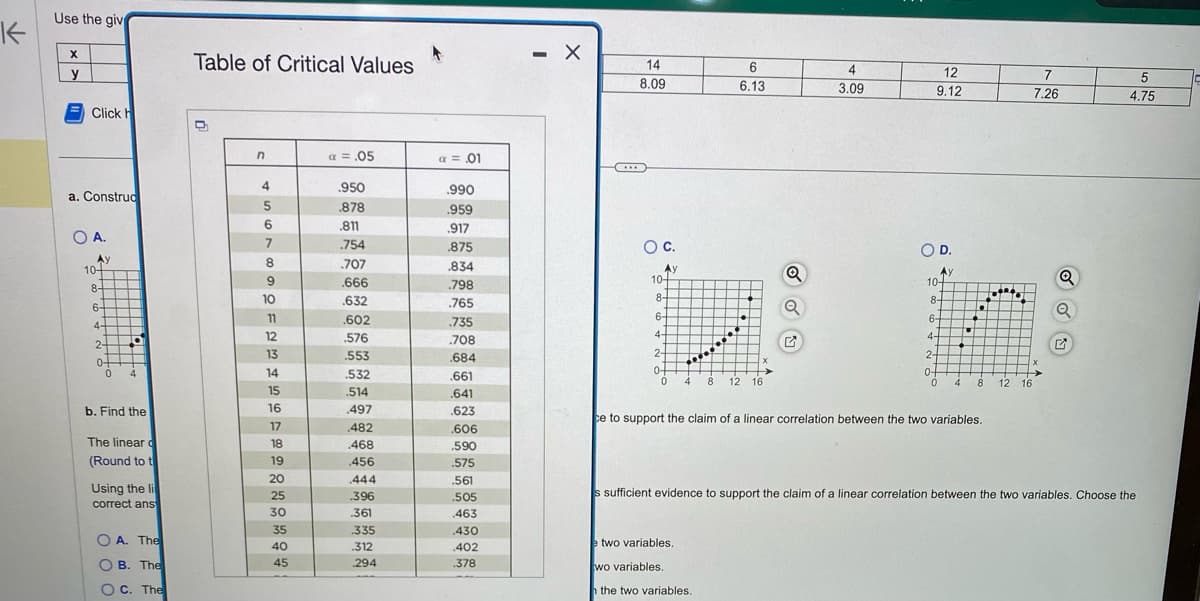
Click here to view a table of critical values for the correlation coefficient.
a. Construct a scatterplot. Choose the correct graph below.
O A
Ay
10-
8
.
6+
52
10
9.14
4-
2-
0+
0
00000
4 8 12 16
OB.
Ay
10+
8-
6-
4-
2
o+
0
......
4 8 12 16
✔
11
9.27
***
14
8.09
O C.
Ay
10+
8-
6-
4-
2-
04
0 4
.......
6
6.13
8
OA. There is insufficient evidence to support the claim of a linear correlation between the two variables.
OB. There is sufficient evidence to support the claim of a linear correlation between the two variables.
OC. There is insufficient evidence to support the claim of a nonlinear correlation between the two variables.
OD. There is sufficient evidence to support the claim of a nonlinear correlation between the two variables.
12 16
4
3.09
12
9.12
O D.
A)
10-
8-
6-
4-
24
2
of
0
4
•
8
b. Find the linear correlation coefficient, r, then determine whether there is sufficient evidence to support the claim of a linear correlation between the two variables.
The linear correlation coefficient is r=.
(Round to three decimal places as needed.)
***
7
7.26
12 16
G
5
4.75
Using the linear correlation coefficient found in the previous step, determine whether there is sufficient evidence to support the claim of a linear correlation between the two variables. Choose the
correct answer below.
O
Transcribed Image Text:K
Use the giv
X
y
Click H
a. Construc
O A.
Ay
10-
8-
6-
4-
MEE
2-
0+
0
E
D
++
L
D
4
b. Find the
The linear d
(Round to t
Using the li
correct ans
OA. The
OB. The
OC. The
Table of Critical Values
D
n
4
S678SOFNM
10
12
13
14
15
16
17
18
19
20
25
30
35
40
45
a = .05
.950
.878
.811
.754
.707
.666
.632
.602
.576
.553
.532
514
.497
.482
.468
.456
.444
.396
.361
.335
.312
294
α = .01
.990
.959
.917
.875
.834
.798
.765
.735
.708
.684
.661
.641
.623
.606
.590
.575
.561
.505
.463
.430
.402
.378
- X
14
8.09
(...)
O C.
Ay
10-
8-
6-
4-
2-
0-
0
..........
4
6
6.13
8
e two variables.
wo variables.
h the two variables.
12 16
Q
G
4
3.09
12
9.12
O D.
A
10+
8-
6
4-
2-
0+
0
Y
+
19
4
8
ce to support the claim of a linear correlation between the two variables.
10
12 16
7
7.26
Q
5
4.75
s sufficient evidence to support the claim of a linear correlation between the two variables. Choose the
Expert Solution
This question has been solved!
Explore an expertly crafted, step-by-step solution for a thorough understanding of key concepts.

Step by step
Solved in 5 steps with 7 images

Recommended textbooks for you
Algebra & Trigonometry with Analytic Geometry
Algebra
ISBN:
9781133382119
Author:
Swokowski
Publisher:
Cengage
Algebra & Trigonometry with Analytic Geometry
Algebra
ISBN:
9781133382119
Author:
Swokowski
Publisher:
Cengage