Use the given information to find the minimum sample size required to estimate an unknown population mean μ. Margin of error: $126, confidence level: 99%, σ=$500 OA. 43 00 B. 105 C. 53 D. 60
Use the given information to find the minimum sample size required to estimate an unknown population mean μ. Margin of error: $126, confidence level: 99%, σ=$500 OA. 43 00 B. 105 C. 53 D. 60

Glencoe Algebra 1, Student Edition, 9780079039897, 0079039898, 2018
18th Edition
ISBN:9780079039897
Author:Carter
Publisher:Carter
Chapter4: Equations Of Linear Functions
Section: Chapter Questions
Problem 8SGR

Related questions
Question
Need help
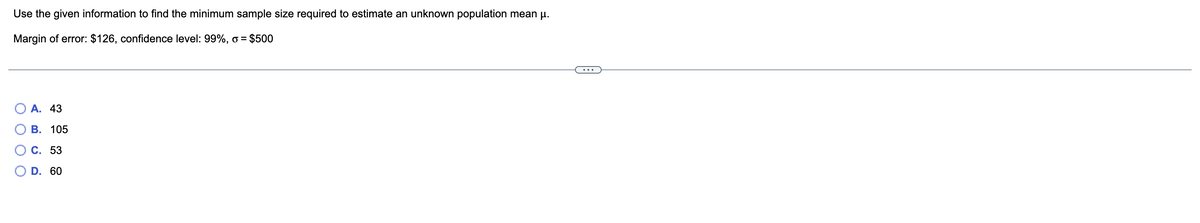
Transcribed Image Text:Use the given information to find the minimum sample size required to estimate an unknown population mean μ.
Margin of error: $126, confidence level: 99%, o = $500
A. 43
B. 105
C. 53
D. 60
Expert Solution
This question has been solved!
Explore an expertly crafted, step-by-step solution for a thorough understanding of key concepts.

Step by step
Solved in 2 steps with 1 images

Recommended textbooks for you
Glencoe Algebra 1, Student Edition, 9780079039897…
Algebra
ISBN:
9780079039897
Author:
Carter
Publisher:
McGraw Hill
Glencoe Algebra 1, Student Edition, 9780079039897…
Algebra
ISBN:
9780079039897
Author:
Carter
Publisher:
McGraw Hill