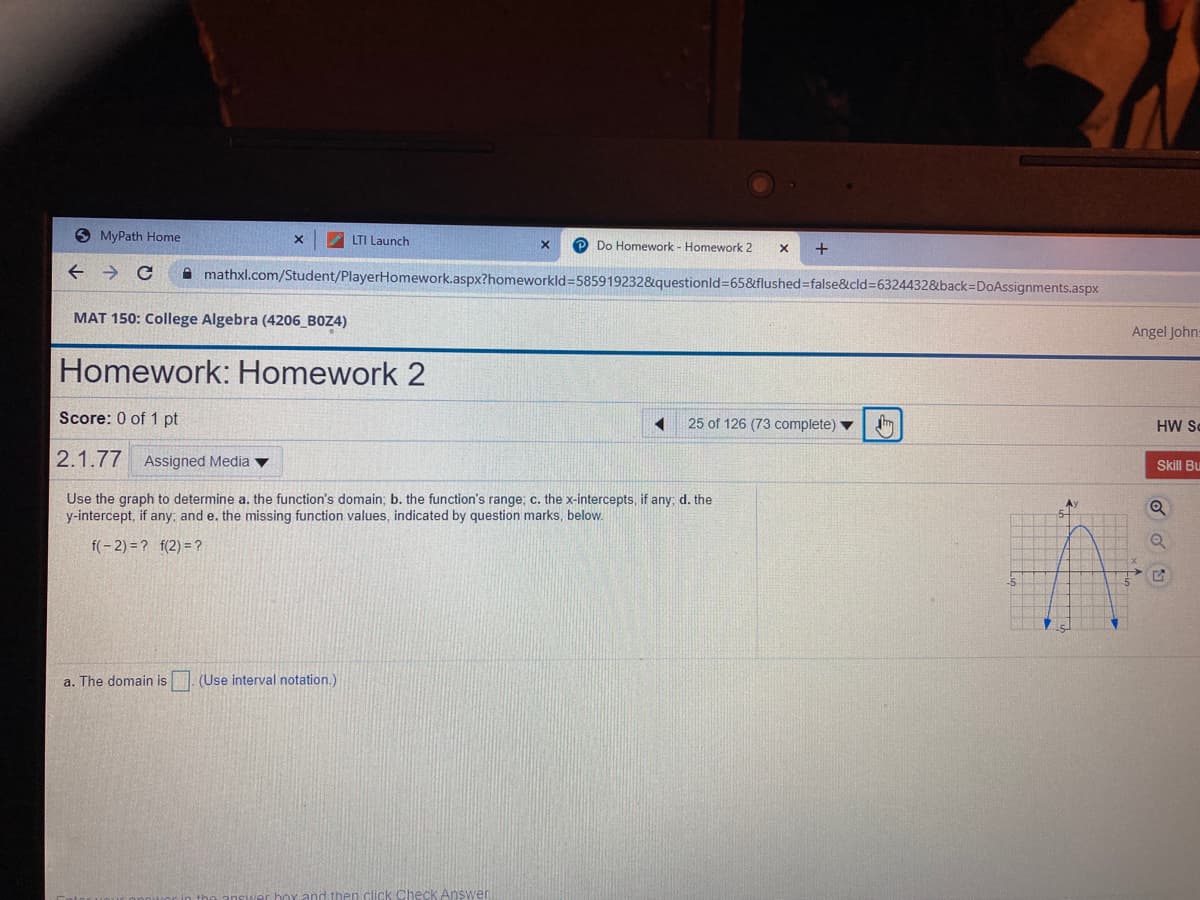
Use the graph to determine a. the function's domain; b. the function's range; c. the x-intercepts, if any; d. the y-intercept, if any: and e. the missing function values, indicated by question marks, below. f(- 2) = ? f(2) = ? a. The domain is (Use interval notation.)
Q: Use the graph of f(x) = |x| to write an equation for the function whose graph is shown. 20 y 16+ 12+…
A:
Q: Use the graph of f(x) = x to vwrite an equation for the function represented by each graph. (a) 4 -3…
A:
Q: Use the graph of f to find indicated function value. f(4)
A:
Q: Use the graph of the function to identify its domain and its range.
A:
Q: Use the graph of f to findthe indicated function value : f(-3)
A:
Q: Use the Vertical Line Test to determine whether the graph represents y as a function of x.
A: Graph is given we have to find it is function of y or not
Q: Graph the function, not by plotting points, but by starting from the graphs below. y = 6 - (+* GY y…
A: 13x is a decay function.Option-D represents it.-13x will be exact reflection of option-D about…
Q: 9. D =
A: Given is
Q: For the function h whose graph is given, state the value of each quantity, if it exists. (If an…
A: Solution L Graph is given we know if graph has more than one value at agiven point. at…
Q: A)-2 B) -3 C) 2 D) 3
A: In these types of problems : F(-1) means what is the value of the function or the value at vertical…
Q: Use the graph of f(x) = x to write an equation for the function represented by each graph. (a) y 3…
A: a we can get the given graph by shifting graph of x3 above y-axis by 1 unit So,…
Q: k(x) = 2.1* (x = -4 to 2)
A: Topic- simplification of exponential function
Q: ts. y=3x sqare - 12x + 9
A: we have to draw the graph of the given y=3x2-12x+9 and identify the x- intercept.
Q: Find the domain and range of the relation.
A: The domain of a function is the set of values of the variable for which the function gives defined…
Q: For the function h whose graph is given, state the value of each quantity, if it exists. (If an…
A:
Q: Use the graph of y = f(x) to find each function value. 10- (a) f( – 4) (c) f(3) (b) f(0) (d) f(8) Q…
A: (a) To find: The value of f(-4). Explanation: It can be seen from the graph that the value of the…
Q: Use the graphs of f and g to evaluate the functions. y= g0x)| (a) (f. 9)(2) (b) (g . N(2)
A:
Q: Use the graph of f to find indicated function value. f(-2)
A: We have to find y value when x=-2f-2=-4x=-2x-axis is plotted in y=-4 y-axisin given graph
Q: Ciraph the function, not by plotting points, but by starting from the graphs below. y-3+1
A: consider the graph(black graph) of the base function
Q: Use the graph of f(x) = x2 to write an equation for the function represented by each graph.
A: (a) Let the given graph be gx and it passes through 1, -3 ……1
Q: Use the graph of f(x) = ∣x∣ to write an equation for the function represented by each graph.
A: This question is taken from the function in which we have to find the function from the given graph…
Q: Find the domain and the range of the relation
A: Clearly from the graph.
Q: Use the graph of f(x) = √x to write an equation for the function represented by each graph.
A: Solution:Given f(x)=xFormula:y=x-a+b
Q: d. Graph MC(x), C(x), and C'(x) for x between 0 and 4 and the vertical axis between x = -20 and x =…
A: We have to find the marginal cost MC(x), the average cost function C(x) and marginal average cost…
Q: For Exercise, graph the functions and write the domain and range in interval notation. h(x) =
A: The graph is,
Q: Use the graph of f to find indicated function value. f(-1)
A: Consider the following graph:
Q: Use the graph of f(x) = x2 to write an equation for the function represented by each graph. (a) y 4…
A: Given, Use the graph of f(x)=x2 to write equation for the function represented by each…
Q: Use the graph of f(x) = x2 to write an equation for the function represented by each graph.
A: Using the graph of fx=x2 to write the equation for the function represented by graph. The graph of…
Q: Use the graph of f(x) = x² to write an equation for the function represented by each graph. (a) y 4…
A: Given: (a) center point ( h,k) = (0 , -2) Passing points : (1,0) or (-1,0) (b) center point…
Q: Graph the function g (x) = 2^ and give its domain and range using interval notation. X-1 8- 6+
A: given g(x)=2x-1
Q: Use the graph of the function, y = f (x), shown below to answer the questions. (a) Find the domain…
A: Disclaimer: Since you have posted a question with multiple sub-parts, we will solve the first…
Q: Which of the following graphs represents a function that includes the values of x and y given in the…
A:
Q: Qu, sketch the graph of the function |– x7 us E =R
A: Find the solution below
Q: For the given functions, find the domain, range and sketch the graph: 1. y = (2 + 3x)/(x – 1)…
A: We have to find domain,range and graph
Q: Use the graph of f (x) = x- to write an equation for the function whose graph is shown. -12 -8 -4 12…
A: The answer of the given question is given by using graph of x² given as follows :
Q: Use the graph of f(x) = x³ to write an equation for the function represented by each graph. (a) g(x)…
A:
Q: Plot the graph of f(x) given, f(x) = xa-1 exp- x) x20, a=9 and Bß= 0.5 Га
A: The given probability density function is as follows: f(x) = βαΓα xα-1exp(-βx); x ≥ 0, α = 9, β =…
Q: Select the choice that is a graph of the function x - 2 3. f(x) 2 (x+ 1)(a-3) -2 -7-6 -5 4-t -2 -2-…
A: Select the choice that is a graph of the function f(x) = (3/2)*(x-2)/((x+1)(x-3))
Q: Find the domain and the range of the relation.
A: We have to find the domain and range from the given graph.
Q: Use the graph of f(x) = x2 to write an equation for the function represented by each graph. (a) y -4…
A:
Q: If f(5)=7, what point is on the graph of f?
A: given f(5)=7,
Q: For Exercise, graph the functions and write the domain and range in interval notation. f(x) = 3x
A: Given:
Q: Find the domain and the range and sketch the graph of the function 3x+ (a)G(x)= x+9 - 2x if x 3…
A: the domain is the set of values that a function can take and the range is the set of values that a…
Q: Use the graph of f(x) = |x| to write an equation for the function represented by each graph. (a) y 2…
A: in the question it is asked to calculate equation of graphs with respect to |x|.
Q: y=f'(x) Vhich of the following could be the graph of the_function, f A) B)
A:
Q: For the function as a whole: what are the x-intercept and y-intercept? (In the form of an ordered…
A:
Q: Use the graph of y f(x) to answer the following ( f. Determine the y-intercept.
A: The given graph is
Q: 9. D = R = Function?
A:
Q: 11. D = R = Function?
A: For the given graph
Q: Use the graph of f to findthe indicated function value : f(-2)
A:
Trending now
This is a popular solution!
Step by step
Solved in 2 steps with 2 images
- How can we classify experimental designs? Explain one in eachcategory.The television show Lett3rs has been successful for many years. That show recently had a share of 19, which means, that among the TV sets in use, 19% were tuned to Lett3rs. An advertiser wants to verify that 19% share value by conducting its own survey, and a pilot survey begins with 10 households have TV sets in use at the time of a Lett3rs broadcast. If at most one household is tuned to Lett3rs, does it appear that the 19% share value is wrong? (Hint: Is the occurrence of at most one household tuned to Lett3rs unusual?) A. no, it is not wrongB. yes, it is wrongThe Transform 66 Outside the Beltway project, scheduled to be completed late 2022, is an expansion of the current highway that will provide new travel choices for drivers and hopefully congestion relief from the Capital Beltway (I-495) to Gainesville for a 22.5 mile stretch. This 22.5 mile stretch of I-66 will go through both Fairfax County and Prince William County. VDOT had team members from the project reach out through a phone survey for a random selection of 3,500 residents from both Fairfax County and Prince William County. One question asked on the survey was “Do you feel that the new I-66 Express Lanes will bring congestion relief?” Of the Fairfax County residents surveyed, 1,642 agreed they thought that the expansion will bring congestion relief while only 1,576 of the Prince William County residents surveyed agreed with the statement. 1) What is a possible confounding variable that might have introduced sampling bias intothe results of the survey? Answer in one to two…
- The Transform 66 Outside the Beltway project, scheduled to be completed late 2022, is an expansion of the current highway that will provide new travel choices for drivers and hopefully congestion relief from the Capital Beltway (I-495) to Gainesville for a 22.5 mile stretch. This 22.5 mile stretch of I-66 will go through both Fairfax County and Prince William County. VDOT had team members from the project reach out through a phone survey for a random selection of 3,500 residents from both Fairfax County and Prince William County. One question asked on the survey was “Do you feel that the new I-66 Express Lanes will bring congestion relief?” Of the Fairfax County residents surveyed, 1,642 agreed they thought that the expansion will bring congestion relief while only 1,576 of the Prince William County residents surveyed agreed with the statement. p1: proportion of successes for population 1p2: proportion of successes for population 2p1 - p2 : Difference in proportions95% confidence…The Transform 66 Outside the Beltway project, scheduled to be completed late 2022, is an expansion of the current highway that will provide new travel choices for drivers and hopefully congestion relief from the Capital Beltway (I-495) to Gainesville for a 22.5 mile stretch. This 22.5 mile stretch of I-66 will go through both Fairfax County and Prince William County. VDOT had team members from the project reach out through a phone survey for a random selection of 3,500 residents from both Fairfax County and Prince William County. One question asked on the survey was “Do you feel that the new I-66 Express Lanes will bring congestion relief?” Of the Fairfax County residents surveyed, 1,642 agreed they thought that the expansion will bring congestion relief while only 1,576 of the Prince William County residents surveyed agreed with the statement 1) Calculate and label the two sample proportions separately and round the values to four decimal places. Next, calculate the difference between…On average, a certain road section results in 4 traffic accidents per month. What is theprobability for any given month at the given road section,a. More than 3 accidents will occur.
- An agronomist is interested in comparing the efficacy of two fumigants (A and B) and a control (O) in eliminating wireworms. A field is divided into 4 sections, each section containing 3 plots. Fumigant A, B and O were randomly assigned to one plot within each section. The number of wireworms that remained on each plot after application of fumigant was recorded. Give a possible RCBD layout for the experiment.A cohort study was conducted over five years among 200 trial attorneys and general practice attorneys after stringent tort law reform, to see how many would develop heart conditions over time. In total, 50 attorneys developed heart disease. It was found that 40 who developed disease practiced trial law, while 10 who developed disease did not practice trial law. One hundred (100) who did not develop disease also did not practice trial law, and 50 who did not develop disease practiced trial law. Set up the 2 x 2 table and calculate the appropriate rate of riskIn search of a mosquito repellent that is safer than the ones that are currently on the market, scientists have developed a new compound that is rated as less toxic than the current compound, thus making a repellent that contains this new compound safer for human use. Scientists also believe that a repellent containing the new compound will be more effective than the ones that contain the current compound. To test the effectiveness of the new compound versus that of the current compound, scientists have randomly selected 100 people from a state. Up to 100 bins, with an equal number of mosquitoes in each bin, are available for use in the study. After a compound is applied to a participant’s forearm, the participant will insert his or her forearm into a bin for 1 minute, and the number of mosquito bites on the arm at the end of that time will be determined. a. Suppose this study is to be conducted using a completely randomized design. Describe a a.randomization process and identify an…
- A case-control study is being planned to see whether proximity to a nuclear power plant is associated with the development of certain cancers. 200 cases and 200 controls will be recruited and the distance from the nearest nuclear power plant will be dichotomized as close (< 3 miles) or far (≥ 3 miles). Use SAS to complete each problem below. (a) It is believed that about 4% of controls live close to the plant and the OR that investigators would be interested in detecting is 3.5. Assuming that a 2-sided, 5% level test will be conducted, what power will the test have for detecting a significant association between cancer and proximity to the power plant? (b) If we still assume a 2-sided, 5% level test, the same exposure probability among controls, same OR, and equal numbers of cases and controls, what will the sample size need to be to have a power of 80%? (c) Since investigators find it very difficult to recruit cases, they decide to recruit three times as many…Currently, studies are being done on whether one COVID vaccine (like Pfizer’s) can be mixed and matched with another COVID vaccine (like Moderna’s). So a person could have the first shot of one and the second shot of the other. Let’s say a study was done to try to determine if mixing and matching is as effective as just using one type for both shots. People show up at a clinic on a Saturday (self-selecting), and are first given the Pfizer vaccine, and then the Moderna vaccine 3 weeks later. Suppose the results showed that only 1% of all of the people got COVID. What is a problem with this study? A) There was no random assignment of participants to groups. B) It is observational, and an experiment would have been better due to the potential of confounding. C) There was no control group, i.e. a group to compare the results to. D) All of the aboveA researcher hypothesizes that people are more likely to be tired after a week of using the computer for 10 hours daily, without wearing blue-light glasses. The researcher randomly assigned 36 participants to one of two groups (Group 1 = without blue-light glasses vs Group 2 = with blue-light glasses). Then, the researcher monitored how many times each participant yawned per hour. How do we represent the alternative hypothesis for this study? Please write this out in words, or express it mathematically.