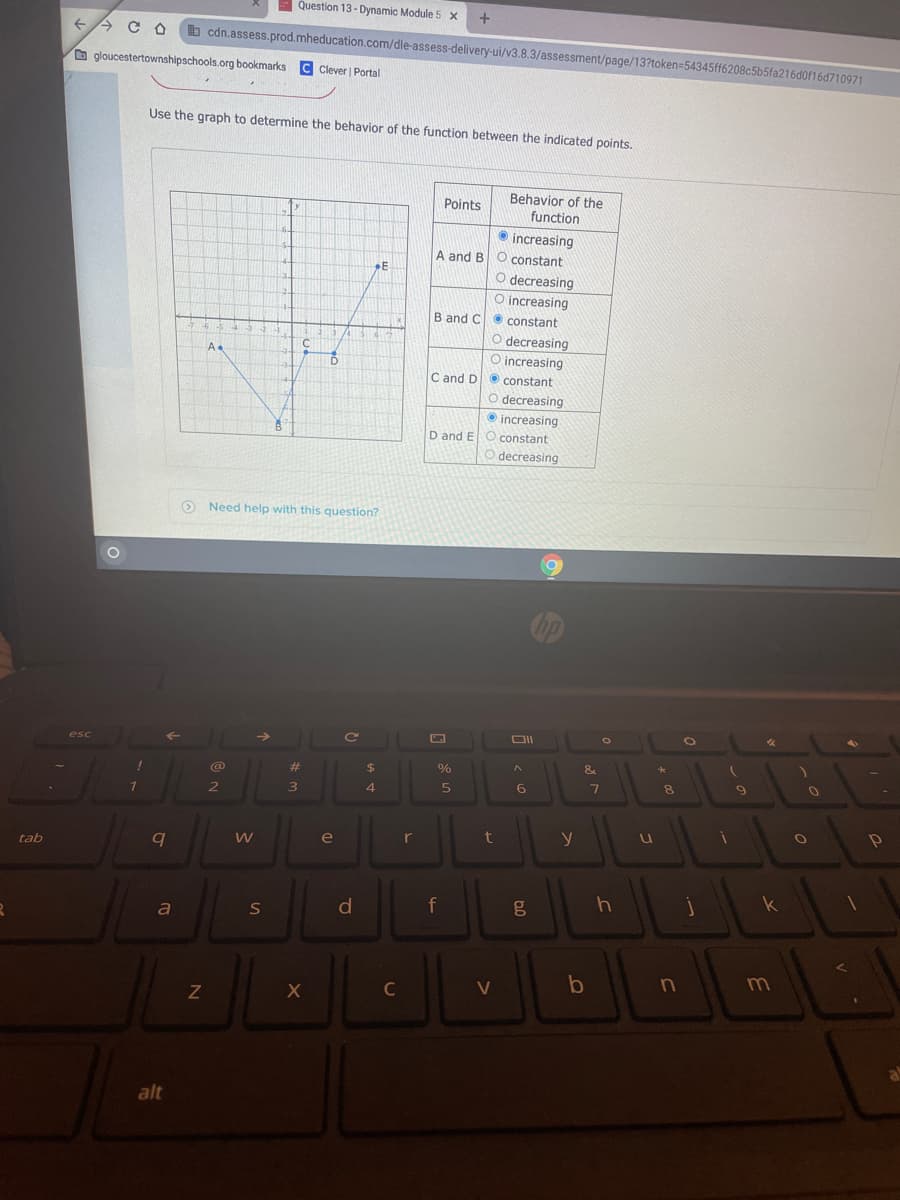
Use the graph to determine the behavior of the function between the indicated points. Behavior of the function Points increasing A and BO constant O decreasing O increasing B and C constant O decreasing O increasing constant O decreasing A C and D increasing D and E constant decreasing
Use the graph to determine the behavior of the function between the indicated points. Behavior of the function Points increasing A and BO constant O decreasing O increasing B and C constant O decreasing O increasing constant O decreasing A C and D increasing D and E constant decreasing

Trigonometry (MindTap Course List)
8th Edition
ISBN:9781305652224
Author:Charles P. McKeague, Mark D. Turner
Publisher:Charles P. McKeague, Mark D. Turner
Chapter4: Graphing And Inverse Functions
Section: Chapter Questions
Problem 6GP: If your graphing calculator is capable of computing a least-squares sinusoidal regression model, use...

Related questions
Question
Transcribed Image Text:Question 13- Dynamic Module 5 x
b cdn.assess.prod.mheducation.com/dle-assess-delivery-ui/v3.8.3/assessment/page/13?token=54345ff6208c5b5fa216d0f16d710971
O gloucestertownshipschools.org bookmarks
C Clever | Portal
Use the graph to determine the behavior of the function between the indicated points.
Behavior of the
function
Points
• increasing
A and BO constant
O decreasing
O increasing
B and CO constant
O decreasing
O increasing
O constant
E
A
C and D
O decreasing
O increasing
D and E O constant
O decreasing
O Need help with this question?
DII
esc
%23
%24
&
6
7
8.
4
e
r
y
tab
d
f
a
m
C
V
alt
Expert Solution
Step 1

Trending now
This is a popular solution!

Step by step
Solved in 2 steps with 2 images

Recommended textbooks for you
Trigonometry (MindTap Course List)
Trigonometry
ISBN:
9781305652224
Author:
Charles P. McKeague, Mark D. Turner
Publisher:
Cengage Learning


Mathematics For Machine Technology
Advanced Math
ISBN:
9781337798310
Author:
Peterson, John.
Publisher:
Cengage Learning,
Trigonometry (MindTap Course List)
Trigonometry
ISBN:
9781305652224
Author:
Charles P. McKeague, Mark D. Turner
Publisher:
Cengage Learning
Mathematics For Machine Technology
Advanced Math
ISBN:
9781337798310
Author:
Peterson, John.
Publisher:
Cengage Learning,

Algebra & Trigonometry with Analytic Geometry
Algebra
ISBN:
9781133382119
Author:
Swokowski
Publisher:
Cengage