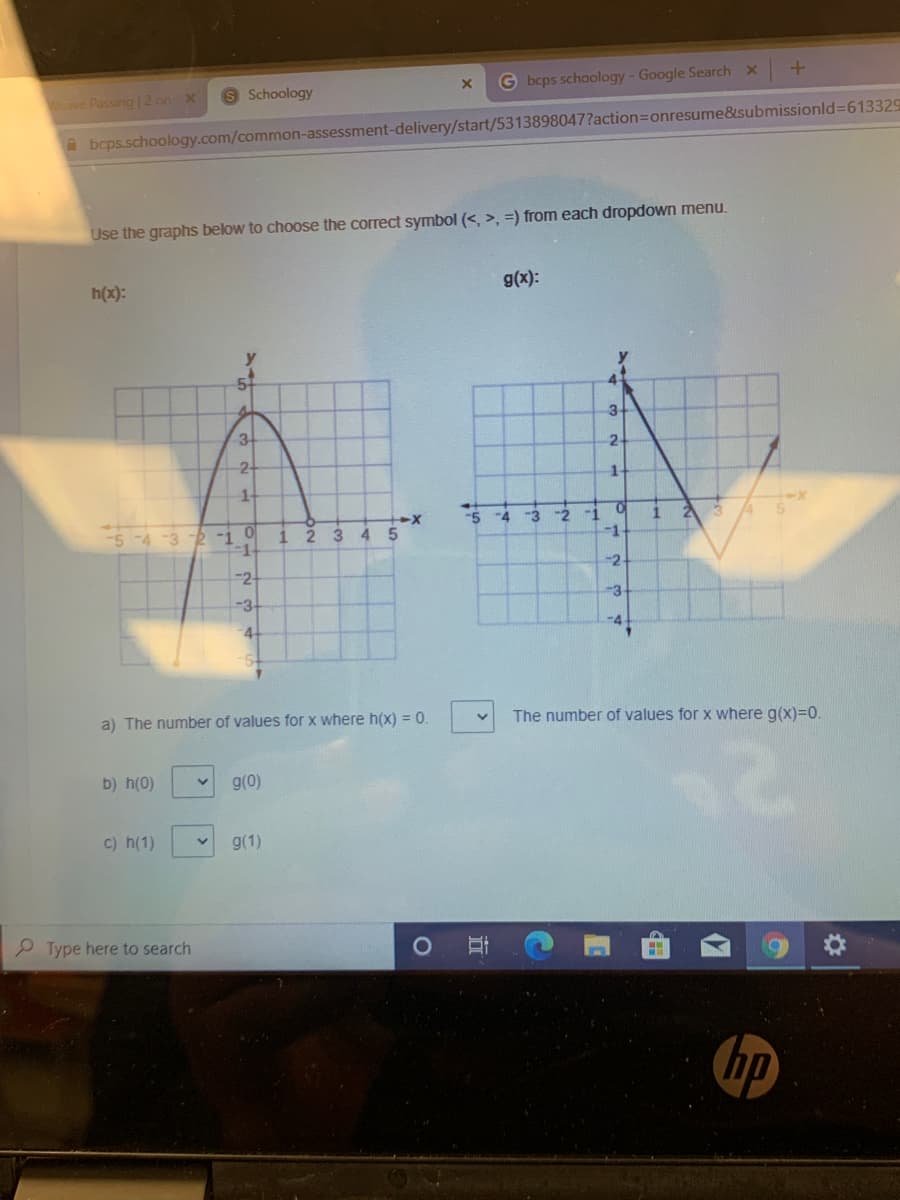
Use the graphs below to choose the correct symbol (<, >, =) from each dropdown menu. h(x): g(x): 51 3. 3 2- 1- -5 4 3 -2 i -54 3 2 -i 0 1 2 345 i 2 -1- -2. -2 -3 -3. a) The number of values for x where h(x) = 0. The number of values for x where g(x)=0. b) h(0) 9(0) 2. 1. 4.
Q: Suppose the graph of f(x) = x2is shifted up 2 unitsand to the right 5 units. What is the equation of…
A: graph of f(x) = x2is shifted up 2 unitsand to the right 5 units.
Q: Use the graph of 5 x y = x² + 4 to approximate the values of x that satisfy y > 1. 1. None of these…
A:
Q: Select the graph of the function y=x+3. 10 10 A -21 -10 -10-4 6 4 3024 E S 10 -10 -10-8 -6 42 2 46…
A:
Q: Label the graphs as f(x) or g(x). f(x) = 4* and g(x) = 2* y A. 3 4 -3 -4- -5 a. f(z) b. g(z) A: B:…
A: Given query is to identify the graph.
Q: y -1 1 2 4 3,
A:
Q: H.w.cl) Q,- Graph the function y= 2
A:
Q: Sketch the graph and determine the domain and range. 1. y = 2 - x, for x 2-4 2. y= x? - 6x + 5, for…
A:
Q: 5. Given the following graph 8(*), determine 41 a) g(0) = 2 b) x when g(x) = 0| c) Domain = -2 Range…
A: see below the answer Domain:- All those points x such that the function f(x) exists.Range:- All…
Q: To graph the sum of two functions y = y 1 + y 2 , at each point add the ___-coordinate from the…
A: To graph the sum of two functions y = y 1 + y 2 , at each point add the x-coordinate from the point…
Q: Sketch the graph and determine the domain and range. 1. y = 2- x,for x 2-4 2. y=x-6x +5. for 1 sx< 5…
A: As per Bartleby guidelines rule I am answering only top 3 questions. Domain : The domain of a…
Q: Use the graph below to answer the question -6 -5 -4 -3 -2 -1 -2 -3 Determine the interval(s) where…
A: Given the graph of f(t) To find the interval in which f(t) < 0
Q: Use the given graph of y = f(x) to solve for what value(s) of x is f(x) = 1?
A:
Q: 3 Graph the equation f(x) = - I + 4. 4 4 2- -5 -4 -3 -2 -1 1 2 3 4 5 -1 -2 -3 3.
A: This question is about graphing the line
Q: Use the following graphs to find the equation of minimum degree. 1000 -1- 500 -2 f(x) = f(x) =
A:
Q: Here is the graph of y = 2x – x². 2- 1- -5 -4 -3 2 3 4 y -1- -2- Find two possible functions f(x)…
A: We need to find inverse function.
Q: You are given a graph. For this exercise, find a formula that defines the function. y 5 4 3 1 -1 -1…
A: Given query is to find the equation of the line.
Q: 10) Find the end behavior of the given graph. As x→-00, f(x) As x→ 0, Ht) 恩) 00,
A:
Q: 8. Given (x) - x', sketch the graphs from y = f(x) to 1 1 (x + 6) 2 (x - 5 = -
A:
Q: The table to the right shows the electricity rates charged by Better Than Lightning Utilities in the…
A: For x>500 , w(x) = Base price + 500*(Price below 500 kwh) + (x-500) * (price above 500 kwh)
Q: The graph of y= f(x) (solid) and y = g(x) (dashed) is shown 6+ 4- -6 -5 -4 -3 -2 -1 5 -2- -3- -4 -5…
A: topic - limits
Q: What is the graph represented by the function f(t) = t + (t - 2)u(t - 1)
A:
Q: 2) Graph f(x) = (x x y 2 (²= 1 0 -1 -2 Fill in the table of values, then graph points and curve.
A: We have to solve above graph
Q: Let c be a fixed constant. Explain the relationship betweenthe graphs of: y = f (x + c) and y = f…
A: To explain: The relation between the graphs of y=fx+c and y=fx in rectangular coordinates. Concept…
Q: 4. Graph the equation: f(x): = 1, -2x + 4, -2, -3≤x≤0 0 ≤ x ≤ 3. x > 3 -1 5+ 44 3- 2+ +1 -1- -24 -3-…
A: This is a graph of piece wise function
Q: 16. The point (6, -5) is on the graph of y = f (x), what point must be on ay 2f(-x) +1?
A: “Since you have asked multiple question, we will solve the first question for you. If you want any…
Q: determine at what point (s) the graphs of f (x)= 4/x+2 and g (x)=1/4-1/5(x+2) intersect.
A:
Q: 4 3 2 1- -5 -4 -3 -2 -1 1 -1- 2 3 4 5* -3- -5+ 2.
A: The y-intercept of a function is the point where the graph of the function crosses the y-axis.
Q: 2x + 6 if z 2 Sketch a graph of f(x) :
A:
Q: The table to the right shows the electricity rates charged by Better Than Lightning Utilities in the…
A: NOTE: Refresh your page if you can't see any equations. . the base charge is $6.5 and for the first…
Q: x,for-2< I<2 2. for x 22 x-1. for x s -2 5. y=
A:
Q: 1. I = dx1 dx2 .. | dx10(x1 + x2 + …+x10)? Please include your code as well as the graphs and…
A: To evaluate: I=∫01dx1∫01dx2⋯∫01dx10x1+x2+⋯+x102
Q: 1. Consider the graph of y= f(x).
A: By graph we can see that f(x) is below x-axis when x is belongs to (6, 12).
Q: graph... f(x)=|x+3|+2. show atleast 5 points for the graph.
A:
Q: Use the graphs of f and g to graph h(x) (f + g)(x). (Graph segments with closed endpoints.) y 3 2 1…
A: Finding the graph of (f+g)(x) from the conditions given
Q: Which of the following is the graph of f(x)= (x-2)^3 A,B,C,D, or E??
A: The given function is x-23. In this question, we have to find which one is the correct graph of the…
Q: 4. Describe how the signs of h and k affect how to obtain the graph of y = f(x – h) +k from the…
A: Here, the objective is to describe how the signs of h and k affect the graph of function y=f(x-h)+k.…
Q: of its graph. Be sure to label the x-values of five key points: x, = +1() = %3D x3=D +2(종) = %3D x,…
A: Angle
Q: The graph of y = f(x) has ƒ(5) = − 5, ƒ'(5) = 1, - - and f''(5) = - 1. Which of the following might…
A: Given query is to find the graph of the function.
Q: The graph of y-Jx) is shown. HS4 2 3 4 5 -2 -3 Evaluate x when x) 4
A: The graph of the function f(x) is shown below:
Q: For what values of x is the graph of y = e concave down?
A:
Q: The graphs of x = 4, y = f(x) (s
A: Volume =∫ab A(x) dxA(x) = π[(Outer radius)2-(Inner radius)2]
Q: Use the guidelines of the section to make a complete graph of ƒ.
A: The given function is f(x) = 1e-x-1
Q: According to the given graph, what is the value of So f' (x) dæ? Not enough information
A: Concept - use the formula for area of triangle from 0 to 1
Q: Use the given graph of y = f(x) to solve graph g(x) = f(x - 1) + 1.
A:
Q: 1. State the increasing and decreasing interval from the graph below: y= f(x)
A: Since you have asked multiple questions, we will solve the first question for you. If you want any…
Q: Which statement is true about the relation shown on the graph below?
A: To be a function , there shouldn't be multiple y values for a given x. Here the given graph doesn't…
Q: The table to the right shows the electricity rates charged by Better Than Lightning Utilities in the…
A:
Q: Graph both f(x)=(1/3)^x and g(x)=2 on the same coordinate system and use the graph to solve…
A: Given functions are fx=13x,gx=2. Graph the above function as shown below. From the above figure,…
Q: 1. Sketch the graph of y=2-x. 2. If fx) =x(*+2)(z-3), use interval notation to give all values of x…
A:
Trending now
This is a popular solution!
Step by step
Solved in 2 steps with 2 images
- what hypothesis do you observe from this graph? performing a Hypothesis?The World Bank collects information on the fertility rate (children per woman) in the country and the life expectancy of a person (in years) in each country ('Life expectancy at,' 2013 and 'Fertility rate,' 2013). The data for 23 randomly selected countries for the year 2011 are in the table below. a) Since data were collected for variable(s), the correct graph to make is a .b) Make a scatterplot of X versus Y using technology. Use this graph to answer the part below. c) Which of the following is true about the relation between fertility rate and average life expectancy based on the graph above?Find and sketch the graph for x=3
- Casey ran a 75-meter race in 10 seconds. Here is a graph of some selected data from her race. To represent the problem situation, should the graph be discrete or continuous? Should the data points in the graph be connected?Function k is in the form y = ax2+ c . If a and c are both greater than 0, which graph could representk? Please help me graphDuring a diagnostic evaluation, a 33-year-old woman experienced a panic attack a few minutes after she had been asked to relax her whole body. The graph shows the rapid increase in heart rate during the panic attack. Solve, a. For which time periods during the diagnostic evaluation was the woman’s heart rate increasing? b. For which time periods during the diagnostic evaluation was the woman’s heart rate decreasing? c. How many turning points (from increasing to decreasing or from decreasing to increasing) occurred for the woman’s heart rate during the first 12 minutes of the diagnostic evaluation? d. Suppose that a polynomial function is used to model the data displayed by the graph using (time during the evaluation, heart rate). Use the number of turning points to determine the degree of the polynomial function of best fit. e. For the model in part (d), should the leading coefficient of the polynomial function be positive or negative? Explain your answer. f. Use the graph to estimate…
- A researcher evaluated the effectiveness of relaxation training in reducing anxiety. One sample of anxiety ridden people received relaxation training, while a second sample did not. Then anxiety scores were measured for all subjects, using a standardized test. Use the information summarized in the following table to complete this item. The Effect of Relaxation Training on Anxiety Scores Group Mean Anxiety Score SE Control group 36 7 Relaxation training 18 5 Construct a graph (by hand) that incorporates all the information in this table. Looking at your graph, do you think that the relaxation training really worked. Explain your answer.which graph shows the following relation?In 2010, MonsterCollege surveyed 1250 U.S.college students expecting to graduate in the next several years.Respondents were asked the following question:What do you think your starting salary will be at your firstjob after college?The line graph shows the percentage of college students whoanticipated various starting salaries. Use the graph to solveExercises 9–14. What starting salary was anticipated by the greatestpercentage of college students? Estimate the percentage ofstudents who anticipated this salary? What starting salary was anticipated by the least percentageof college students? Estimate the percentage of students whoanticipated this salary? What starting salaries were anticipated by more than 20% ofcollege students? Estimate the percentage of students who anticipated astarting salary of $40 thousand.
- Interpret the graph the expresses at least 3 different situations (pieces such as peak points, landing, output, lowest point, interchange points.)A developing country's economy is based on exporting raw materials to the United States . The country sells raw materials for U.S. dollars and converts them to its own currency at current exchange rates. The table shows these exchange rates for the years 1990 to 2020 . Based on the graph, which conclusion best describes the country's economic situation between 1990 and 2000?Draw the graph of y = - f(-x)