a) Since data were collected for variable(s), the correct graph to make is a . b) Make a scatterplot of X versus Y using technology. Use this graph to answer the part below. c) Which of the following is true about the relation between fertility rate and average life expectancy based on the graph above?
a) Since data were collected for variable(s), the correct graph to make is a . b) Make a scatterplot of X versus Y using technology. Use this graph to answer the part below. c) Which of the following is true about the relation between fertility rate and average life expectancy based on the graph above?

Holt Mcdougal Larson Pre-algebra: Student Edition 2012
1st Edition
ISBN:9780547587776
Author:HOLT MCDOUGAL
Publisher:HOLT MCDOUGAL
Chapter11: Data Analysis And Probability
Section11.4: Collecting Data
Problem 6E

Related questions
Question
The World Bank collects information on the fertility rate (children per woman) in the country and the life expectancy of a person (in years) in each country ('Life expectancy at,' 2013 and 'Fertility rate,' 2013). The data for 23 randomly selected countries for the year 2011 are in the table below.
a) Since data were collected for variable(s), the correct graph to make is a .
b) Make a
c) Which of the following is true about the relation between fertility rate and average life expectancy based on the graph above?
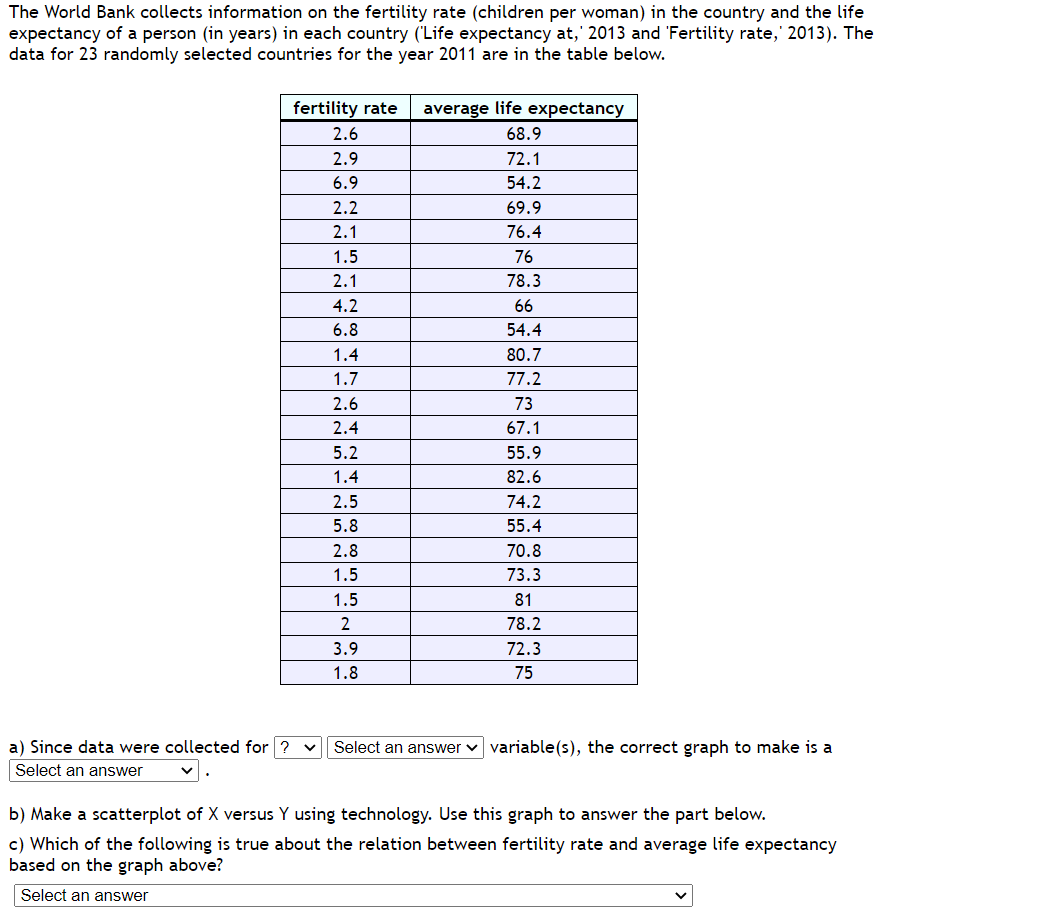
Transcribed Image Text:The World Bank collects information on the fertility rate (children per woman) in the country and the life
expectancy of a person (in years) in each country ('Life expectancy at, 2013 and 'Fertility rate, 2013). The
data for 23 randomly selected countries for the year 2011 are in the table below.
a) Since data were collected for ?
Select an answer
fertility rate average life expectancy
68.9
72.1
54.2
2.6
2.9
6.9
2.2
2.1
1.5
2.1
4.2
6.8
1.4
1.7
2.6
2.4
5.2
1.4
2.5
5.8
2.8
1.5
1.5
2
3.9
1.8
69.9
76.4
76
78.3
66
54.4
80.7
77.2
73
67.1
55.9
82.6
74.2
55.4
70.8
73.3
81
CON
78.2
72.3
75
Select an answer ✓ variable(s), the correct graph to make is a
b) Make a scatterplot of X versus Y using technology. Use this graph to answer the part below.
c) Which of the following is true about the relation between fertility rate and average life expectancy
based on the graph above?
Select an answer
V
Expert Solution
This question has been solved!
Explore an expertly crafted, step-by-step solution for a thorough understanding of key concepts.

This is a popular solution!

Trending now
This is a popular solution!

Step by step
Solved in 3 steps with 1 images

Recommended textbooks for you
Holt Mcdougal Larson Pre-algebra: Student Edition…
Algebra
ISBN:
9780547587776
Author:
HOLT MCDOUGAL
Publisher:
HOLT MCDOUGAL

College Algebra (MindTap Course List)
Algebra
ISBN:
9781305652231
Author:
R. David Gustafson, Jeff Hughes
Publisher:
Cengage Learning

Holt Mcdougal Larson Pre-algebra: Student Edition…
Algebra
ISBN:
9780547587776
Author:
HOLT MCDOUGAL
Publisher:
HOLT MCDOUGAL
College Algebra (MindTap Course List)
Algebra
ISBN:
9781305652231
Author:
R. David Gustafson, Jeff Hughes
Publisher:
Cengage Learning