Use the information below to construct a 2x2 table and answer the following question: Risk Factor Has Outcome 19 53 Exposed Not Exposed What is the population attributable risk percentage? a. 47.5% b.63.1% c. 12.5% d.09.2% Outcome Does Not Have Outcome 139 789
Use the information below to construct a 2x2 table and answer the following question: Risk Factor Has Outcome 19 53 Exposed Not Exposed What is the population attributable risk percentage? a. 47.5% b.63.1% c. 12.5% d.09.2% Outcome Does Not Have Outcome 139 789

Glencoe Algebra 1, Student Edition, 9780079039897, 0079039898, 2018
18th Edition
ISBN:9780079039897
Author:Carter
Publisher:Carter
Chapter4: Equations Of Linear Functions
Section: Chapter Questions
Problem 8SGR

Related questions
Question
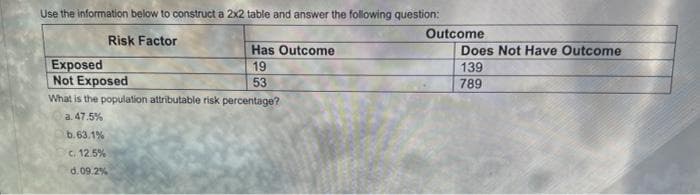
Transcribed Image Text:Use the information below to construct a 2x2 table and answer the following question:
Risk Factor
Has Outcome
19
53
Exposed
Not Exposed
What is the population attributable risk percentage?
a. 47.5%
b.63.1%
c. 12.5%
d.09.2%
Outcome.
Does Not Have Outcome
139
789
Expert Solution
This question has been solved!
Explore an expertly crafted, step-by-step solution for a thorough understanding of key concepts.

Step by step
Solved in 2 steps

Recommended textbooks for you
Glencoe Algebra 1, Student Edition, 9780079039897…
Algebra
ISBN:
9780079039897
Author:
Carter
Publisher:
McGraw Hill
Glencoe Algebra 1, Student Edition, 9780079039897…
Algebra
ISBN:
9780079039897
Author:
Carter
Publisher:
McGraw Hill