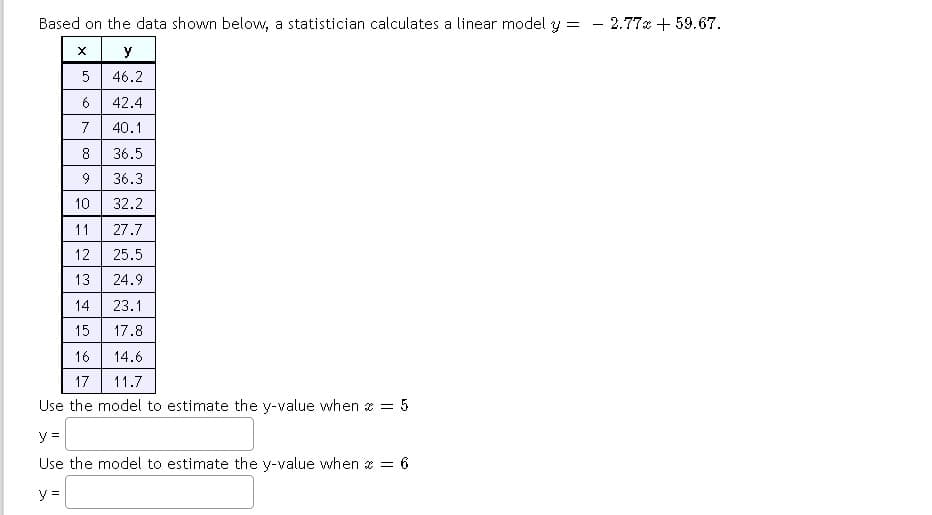
Use the model to estimate the y-value when * = 5 y = Use the model to estimate the y-value when * = 6 y =


Q: Using 95% confidence, suppose 64 out of 320 people received fruit in addition to candy. Which of the…
A:
Q: Assignment- I A brochure inviting subscriptions for a new diet program states that the participants…
A: The question is about hypo. testing for a popl. mean Given : Popl. std. deviation of weight loss ( σ…
Q: 7.1: Identify the critical t. An independent random sample is selected from an approximately normal…
A: Given,sample size(n)=28α=1-0.98=0.02α=0.02
Q: Blue sheep Logistic company delivering parcels. They realized the advantages of forecasting very…
A: The question is about forecasting Given :
Q: 8. A Pearson's r correlation coefficient that is equal to 0.49 means that: - O The degree or…
A: Solution :- The degree or strength of the influence of one variable towards the variable is moderate…
Q: Suppose the diameter of holes for a cable harness is known to have a mean of 1.4 inches. A random…
A:
Q: 22 17 29 36 42 24 24 25 99% CI for the standard deviation of the coating layer thickness…
A: Given 22,17,29,36,42,24,24,25
Q: 5. The probability that Stu doesn't do his homework is 3/4. The probability that his teacher…
A: A tree diagram is used to represent a probability space. Each node of the tree on the diagram…
Q: In a survey of 458 random households, people take pride in discussing their methods of environmental…
A: Given n=458x=236confidence interval = 95%
Q: What is a marginal probability function
A: Probability distribution
Q: Conduct the hypothesis test and provide the test statistic, critical value and P-value, and state…
A: The null and alternative hypotheses are stated below: H0: P1= P2= P3= P4 Ha: At least one Pi is…
Q: Q3: The effective life of a component used in a jet-turbine aircraft engine is a random variable…
A: The effective life of a component used in a jet-turbine aircraft engine is a random variable with…
Q: he monthly utility bills in a city are normally distributed, with a mean of $100 and a standard…
A: Given that The data of monthly utility bills is normally distributed with Mean (μ) = $100 Standard…
Q: Ultra high performance concrete (UHPC) is a relatively new construction material that is…
A: For the given data, First we will calculate mean and standard deviation. Than we have to…
Q: Which of the following is the point estimate of the parameter stated in question 2? ㅠ f V
A: The population proportion can be denoted by π.
Q: 15. The probability that the sample mean weight of the raspberries is no (Round off your final…
A:
Q: Assume the random variable x is normally distributed with mean μ=50 and standard deviation σ=7. Find…
A:
Q: nt Comparison of Fatty Acid content of Italian Olive Producers 85 80
A: From the above plots, it is obvious that the 1) These plots have been drawn in the 2D plane where…
Q: Draw five cards from a deck of 52 cards without replacement. Let X = number of spades drawn Y =…
A: Given, Draw five cards from a deck of 52 cards without replacement. Let X= number of spades drawn Y…
Q: On average is the younger sibling's IQ different from the older sibling's IQ? Ten sibling pairs were…
A: From the provided information, Sample size (n) = 10 Level of significance (α) = 0.01
Q: Which of the following is NOT true of the goodness-of-fit test? Question content area bottom…
A: Chi square goodness of fit is used to check whether data fits a particular distribution.
Q: If the probability that it will snow tomorrow is 0.15, what is the probability that it will not snow…
A: Let A be the event of it will snow tomorrow
Q: dar Standard Normal Table Z .00 .03 .04 .05 .06 .07 Z 0.0 0.1 0.2 0.3 0.4 0.5 0.6 0.7 0.8 0.8 0.9…
A:
Q: The effective life of a component used in a jet-turbine aircraft engine is a random variable with…
A: Given that: For Old process: μ1=5000σ1=40 For Improved process: μ2=5050σ2=30 Two sample means: n1 =…
Q: It is claimed that the average weight of a bag of biscuits is 250 grams with a standard deviation of…
A: The average weight of bag is 250 grams with SD of 20 grams μ=250 σ=20 A random sample of 50 bags of…
Q: An epidemiologist needs to estimate the proportion of residents of Indian River county that have…
A: Given : Margin of error: ME = 0.076
Q: 17. Based on the p-value=0.078 evidence to say that the data significance. A. sufficient; follow B.…
A: Hypothesis testing
Q: 2. The manager of XXX Supermarket is making a study of the amounts customers spend in the…
A:
Q: For effective learning, an instructor advised his students to practice solving statistical problems…
A: Use The Excel and Calculate the Sample Mean And Sample Stannard deviation
Q: 1) The population regression function for the 2-variable model is Y,= B, + B,X, +U, Where Ui is used…
A: Given information: No. of variables in model=2Model, Yi=B0+B1X1+UiSurrogate variable=Ui
Q: Σx = Σy = Σxy = Σχε a= b Equation of the regression line If x = 10, then y
A: here given , data for x and y here use regression line formula
Q: 30. Based on the R output, the most appropriate coefficient to describe the relationship between…
A: The R-output of Pearson's correlation and Spearman's correlation is given.
Q: Problems 1. Consider a discrete random variable X with the following pmf: 1 Px(x) = x(x + 1) x =…
A: * ANSWER
Q: Question 3 A bowl contains twelve batteries of which four are new, five are used (working) and three…
A: GivenTotal number of working batteries (used) =5Total number of new batteries =4Total defective…
Q: Let Y represent the profit (or loss) for a certain company X years after 1965. Based on the data…
A: The following information has been given: The linear model is : Y=-0.53X+22.91 Y represents the…
Q: Two different forecasting techniques (F1 and F2) were used to forecast demand for cases of bottled…
A: we need to find MSE and MAPE MSE = Average(dev^2) = 253/8 = 31.62 MAPE = Average((abs…
Q: What are continuous probability distributions?
A:
Q: Consider the fitted values from a simple linear regression model with intercept: yˆ = 5 + 6x. Assume…
A:
Q: Calculate the regression coefficient and obtain the lines of regression for the following data: USE…
A: Y on x The regression analysis is conducted here by using EXCEL. The software procedure is given…
Q: The Martin County Economic Development Board needs to estimate the proportion of all county…
A: Given n=145, p^=0.327 Construct Margin of error and confidence interval.
Q: ①3) 3 1501000 What is the expected value of Y if the distribution of Y is given as: 20 1)-5 ① 21 0…
A: Y p ( Y) -5 0.4 0 0.3 10 0.1 20 0.2
Q: According to her doctor, Mrs. Cooper's cholesterol level is higher than only 15% of the females aged…
A: From the provided information, Mean (µ) = 240 Standard deviation (σ) = 25
Q: TV advertising agencies face increasing challenges in reaching audience members because viewing TV…
A: The provided information is n=2342p^=0.58α=0.01The critical value is zc=2.58 (from statistical…
Q: Please, I need Help! Please, if possible, I would like the step by step to be able to do the other…
A: Since you have asked multiple questions, we will solve the first question for you. If you want any…
Q: Q3: If the probability that student (A) will solve a particular problem is (0.8), the probability…
A:
Q: For each research scenario below, indicate: which hypothesis test (z-score test, one-sample t-test,…
A: Statistics is classified into descriptive statistics and inferential statistics. Descriptive…
Q: Which of the following provides both the correct null and the correct alternative hypothesis for…
A: Given : π = 0.62
Q: Assume a Normal distribution. What can be concluded at the the a = 0.05 level of significance? For…
A: Paired t-test statistic: In order to test a hypothesis regarding whether the difference between a…
Q: (a) true (b) false 3. Variance is one type of measure (a) central tendency (b) standard numbers (c)…
A: 1. The sampling method is one of the methods of data collection. a. True. We are collecting the data…
Q: 2) In a digital poster making contest, two judges gave their ratings to eight participants. See…
A: Obtain the value of the spearman’s rank correlation coefficient. The value of the spearman’s rank…


Trending now
This is a popular solution!

Step by step
Solved in 2 steps

- The following fictitious table shows kryptonite price, in dollar per gram, t years after 2006. t= Years since 2006 0 1 2 3 4 5 6 7 8 9 10 K= Price 56 51 50 55 58 52 45 43 44 48 51 Make a quartic model of these data. Round the regression parameters to two decimal places.Find the equation of the regression line for the following data set. x 1 2 3 y 0 3 4Use the table of values you made in part 4 of the example to find the limiting value of the average rate of change in velocity.
- bThe average rate of change of the linear function f(x)=3x+5 between any two points is ________.(b) Find a linear model using the first and last data points. (Use x for income measured in dollars and y for ulcers per 100 people. Round your values to eight decimal places.)Based on the data shown below, a statistician calculates a linear model y=2.41x+2.76y=2.41x+2.76. x y 4 12.5 5 14.35 6 16.9 7 20.65 8 22.1 9 23.95 Use the model to estimate the yy-value when x=9x=9y=y=
- A supermarket has a chain of 12 stores in Kuwait. Sales figures and profits for the stores are given in the following table. Obtain a regression equation for the data, and predict profit for a store assuming sales of $20 million. Show all calculations in detail. Sales, x (in millions of dollars) Profits, y (in millions of dollars) 7 0.12 2 0.1 6 0.13 12 0.15 14 0.25 16 0.2 10 0.24 12 0.2 14 0.27 20 0.15 7 0.34 8 0.17The data in the following table show the amount of water in milliliters a professional tennis player loses for various times, in minutes, of play during a tennis match. Time of Workout(in minutes), x 10 20 30 40 50 60 Water Lost(in milliliters), y 500 900 1,200 1,500 2,000 2,200 (a) Use the points (10, 500) and (60, 2,200) to find a linear model that will predict the water lost y (in mL) by a player who has been playing for x minutes. y = (b) Use your linear model to estimate the amount of water lost (in mL) by a player who has been playing for 15 minutes. mLThe following table represents the survey result from the seven online stores. Use linear regression to find the linear equation that is best fit for the data, width x equal to the online advertising. Round your coefficient to three decimal places. Online Store Online Advertising (in thousand dollars) Monthly e-commerce Sales (in thousand dollars) 1 1.5 368 2 1.7 340 3 2.8 665 4 5 954 5 1.3 331 6 2.2 556 7 1.3 376
- The data in the following table show the amount of water in milliliters a professional tennis player loses for various times, in minutes, of play during a tennis match. Time of Workout(in minutes), x 10 20 30 40 50 60 Water Lost(in milliliters), y 600 900 1,200 1,500 2,000 2,200 (a)Use the points (10, 600) and (60, 2,200) to find a linear model that will predict the water lost y (in mL) by a player who has been playing for x minutes. (b) Use your linear model to estimate the amount of water lost (in mL) by a player who has been playing for 15 minutes.The below data on the production volume x and total cost y (in dollars) for a particular manufacturing operation were used to develop the estimated regression equation y = 1,217.33 + 7.68x. Production Volume Total Cost ($) $ (units) 400 Submit Answer 450 550 600 700 750 4,100 4,900 5,400 5,900 6,500 (a) The company's production schedule shows that 650 units must be produced next month. What is the point estimate of the total cost (in dollars) for next month? (Round your answer to the nearest cent.) $6209.33 7,000 (b) Develop a 99% prediction interval for the total cost (in dollars) for next month. (Round your answers to the nearest cent.) X to $ X (c) If an accounting cost report at the end of next month shows that the actual production cost during the month was $6,700, should managers be concerned about incurring such a high total cost for the month? Discuss. Since $6,700 is within the prediction interval, managers should not be concerned about Incurring such a high total cost for one…) A real estate magazine reported the results of a regression analysis designed to predict theprice (y), measured in dollars, of residential properties recently sold in a northern Virginiasubdivision. One independent variable used to predict sale price is GLA, gross living area(x), measured in square feet. Data for 157 properties were used to fit the model,? = β0 + β1x.The results of the simple linear regression are provided below.y = 96,600 +22.5x s = 6500 r2 = -0.77 t = 6.1 (for testing β1)Interpret the estimate of β0 the y-intercept of the line.a. About 95% of the observed sale prices fall within $96,600 of the least squares line.b. There is no practical interpretation, since a gross living area of 0 is a nonsensicalvalue.c. All residential properties in Virginia will sell for at least $96,600.d. For every 1-sq ft. increase in GLA, we expect a property's sale price to increase$96,600.

