Use the preceding financial statements to complete the following table. Assume the industry averages given in the table are applicable for both 2011 and 2012. Ratio Industry average Actual 2011 Actual 2012 Current ratio 1.80 1.84 Quick ratio 0.70 0.78 Inventory turmover 2.50 2.59 ||
Use the preceding financial statements to complete the following table. Assume the industry averages given in the table are applicable for both 2011 and 2012. Ratio Industry average Actual 2011 Actual 2012 Current ratio 1.80 1.84 Quick ratio 0.70 0.78 Inventory turmover 2.50 2.59 ||

Financial & Managerial Accounting
13th Edition
ISBN:9781285866307
Author:Carl Warren, James M. Reeve, Jonathan Duchac
Publisher:Carl Warren, James M. Reeve, Jonathan Duchac
Chapter15: Financial Statement Analysis
Section: Chapter Questions
Problem 15.17EX: Profitability ratios The following selected data were taken from the financial statements of...

Related questions
Question
A. Use the preceding financial statements to complete the following table. Assume that the industry averages given in the table are applicable for both 2002 and 2003. Thank you
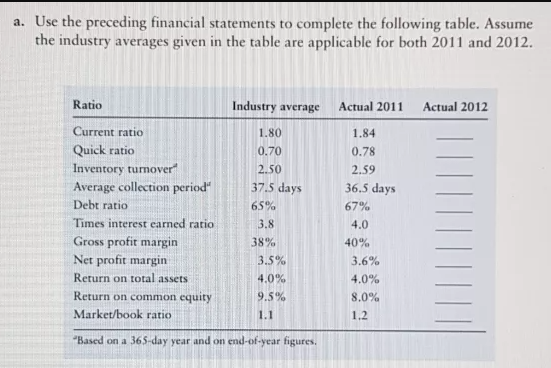
Transcribed Image Text:a. Use the preceding financial statements to complete the following table. Assume
the industry averages given in the table are applicable for both 2011 and 2012.
Ratio
Industry average Actual 2011
Actual 2012
Current ratio
1.80
1.84
Quick ratio
0.70
0.78
Inventory turnover"
2.50
2.59
37.5 days
Average collection period"
Debt ratio
36.5 days
65%
67%
Times interest earned ratio
3.8
4.0
Gross profit margin
Net profit margin
38%
40%
3.5%
3.6%
Return on total assets
4.0%
4.0%
Return on common equity
9.5%
8.0%
Market/book ratio
1.1
1,2
"Based on a 365-day year and on end-of-year figures.
Transcribed Image Text:Financial Statements and Ratio Analysis
107
CHAPTER 3
LG 6
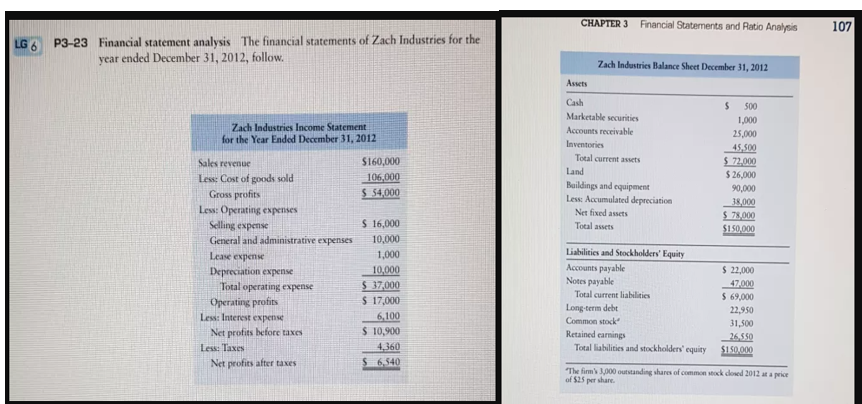
P3-23 Financial statement analysis The financial statements of Zach Industries for the
year ended December 31, 2012, follow.
Zach Industries Balance Sheet December 31, 2012
Assets
Cash
00
Marketable securities
1,000
Zach Industries Income Statement
for the Year Ended December 31, 2012
Accounts receivable
25,000
Inventories
45,500
$ 72,000
$ 26,000
Sales revenue
S160,000
Total current assets
Land
Less: Cost of goods sold
Gross profits
106,000
S 54.000
Baildings and equipment
Less: Accumulated depreciation
90,000
Less: Operating espenses
Selling expense
General and administrative expenses
38,000
S 78,000
$150,000
Net fixed assets
$ 16,000
10,000
Total assets
Lease expense
1,000
Liabilities and Stockholders' Equity
Accounts payable
10,000
$ 37,000
$ 17,000
$ 22,000
Depreciation expense
Total operating expense
Notes payable
47,000
$ 69,000
Total current liabilities
Operating profits
Less: Interest expense
Long-term debt
Common stock
Retained earnings
Total liabilities and stockholders' equity
22,950
6,100
S 10,900
4,360
$ 6,540
31,500
Net profits before taxes
26,550
$150.000
Less: Taxes
Net profits after taxes
The firm's 00 outstanding shares of common sock dlosed 2012 ata price
of $25 per share.
Expert Solution
This question has been solved!
Explore an expertly crafted, step-by-step solution for a thorough understanding of key concepts.

This is a popular solution!

Trending now
This is a popular solution!

Step by step
Solved in 3 steps

Knowledge Booster


Learn more about
Need a deep-dive on the concept behind this application? Look no further. Learn more about this topic, accounting and related others by exploring similar questions and additional content below.Recommended textbooks for you
Financial & Managerial Accounting
Accounting
ISBN:
9781285866307
Author:
Carl Warren, James M. Reeve, Jonathan Duchac
Publisher:
Cengage Learning

Survey of Accounting (Accounting I)
Accounting
ISBN:
9781305961883
Author:
Carl Warren
Publisher:
Cengage Learning

Intermediate Accounting: Reporting And Analysis
Accounting
ISBN:
9781337788281
Author:
James M. Wahlen, Jefferson P. Jones, Donald Pagach
Publisher:
Cengage Learning
Financial & Managerial Accounting
Accounting
ISBN:
9781285866307
Author:
Carl Warren, James M. Reeve, Jonathan Duchac
Publisher:
Cengage Learning
Survey of Accounting (Accounting I)
Accounting
ISBN:
9781305961883
Author:
Carl Warren
Publisher:
Cengage Learning
Intermediate Accounting: Reporting And Analysis
Accounting
ISBN:
9781337788281
Author:
James M. Wahlen, Jefferson P. Jones, Donald Pagach
Publisher:
Cengage Learning

Financial Accounting: The Impact on Decision Make…
Accounting
ISBN:
9781305654174
Author:
Gary A. Porter, Curtis L. Norton
Publisher:
Cengage Learning

Fundamentals of Financial Management (MindTap Cou…
Finance
ISBN:
9781337395250
Author:
Eugene F. Brigham, Joel F. Houston
Publisher:
Cengage Learning