Use the sample data and confidence level given below to complete parts (a) through (d). In a study of cell phone use and brain hemispheric dominance, an Internet survey was e-mailed to 2482 subjects randomly selected from an online group involved wi ears. 1104 surveys were returned. Construct a 90% confidence interval for the proportion of returned surveys. Click the icon to view a table of z scores. a) Find the best point estimate of the population proportion p. (Round to three decimal places as needed.) b) Identify the value of the margin of error E. (Round to three decimal places as needed.) c) Construct the confidence interval. (Round to three decimal places as needed.) d) Write a statement that correctly interprets the confidence interval. Choose the correct answer below. O A. There is a 90% chance that the true value of the population proportion will fall between the lower bound and the upper bound. O B. One has 90% confidence that the interval from the lower bound to the upper bound actually does contain the true value of the population proportion. OC. 90% of sample proportions will fall between the lower bound and the upper bound.
Use the sample data and confidence level given below to complete parts (a) through (d). In a study of cell phone use and brain hemispheric dominance, an Internet survey was e-mailed to 2482 subjects randomly selected from an online group involved wi ears. 1104 surveys were returned. Construct a 90% confidence interval for the proportion of returned surveys. Click the icon to view a table of z scores. a) Find the best point estimate of the population proportion p. (Round to three decimal places as needed.) b) Identify the value of the margin of error E. (Round to three decimal places as needed.) c) Construct the confidence interval. (Round to three decimal places as needed.) d) Write a statement that correctly interprets the confidence interval. Choose the correct answer below. O A. There is a 90% chance that the true value of the population proportion will fall between the lower bound and the upper bound. O B. One has 90% confidence that the interval from the lower bound to the upper bound actually does contain the true value of the population proportion. OC. 90% of sample proportions will fall between the lower bound and the upper bound.

Glencoe Algebra 1, Student Edition, 9780079039897, 0079039898, 2018
18th Edition
ISBN:9780079039897
Author:Carter
Publisher:Carter
Chapter10: Statistics
Section10.5: Comparing Sets Of Data
Problem 14PPS

Related questions

Question
100%
Use the sample data and confidence level given below to complete parts (a) through (d).
In a study of cell phone use and brain hemispheric dominance, an Internet survey was e-mailed to
2482
2482 subjects randomly selected from an online group involved with ears.
1104
1104 surveys were returned. Construct a
90
90% confidence interval for the proportion of returned surveys.
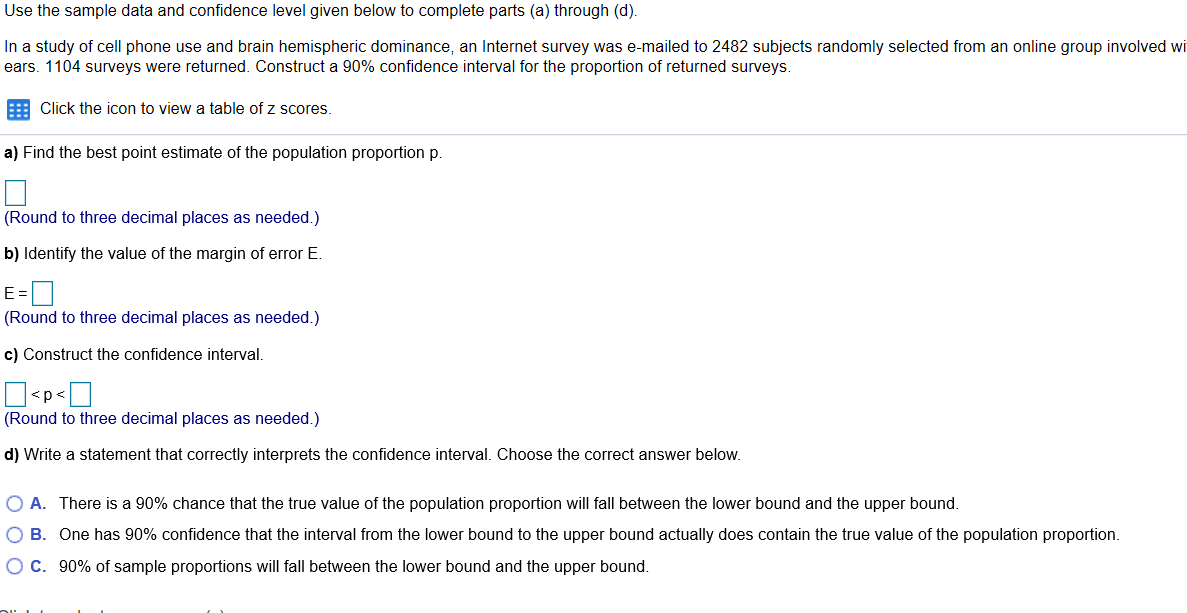
Transcribed Image Text:Use the sample data and confidence level given below to complete parts (a) through (d).
In a study of cell phone use and brain hemispheric dominance, an Internet survey was e-mailed to 2482 subjects randomly selected from an online group involved wi
ears. 1104 surveys were returned. Construct a 90% confidence interval for the proportion of returned surveys.
::: Click the icon to view a table of z scores.
a) Find the best point estimate of the population proportion p.
(Round to three decimal places as needed.)
b) Identify the value of the margin of error E.
E=O
(Round to three decimal places as needed.)
c) Construct the confidence interval.
<p<
(Round to three decimal places as needed.)
d) Write a statement that correctly interprets the confidence interval. Choose the correct answer below.
O A. There is a 90% chance that the true value of the population proportion will fall between the lower bound and the upper bound.
O B. One has 90% confidence that the interval from the lower bound to the upper bound actually does contain the true value of the population proportion.
OC. 90% of sample proportions will fall between the lower bound and the upper bound.
Expert Solution
This question has been solved!
Explore an expertly crafted, step-by-step solution for a thorough understanding of key concepts.

This is a popular solution!

Trending now
This is a popular solution!

Step by step
Solved in 4 steps with 3 images

Knowledge Booster


Learn more about
Need a deep-dive on the concept behind this application? Look no further. Learn more about this topic, statistics and related others by exploring similar questions and additional content below.Recommended textbooks for you
Glencoe Algebra 1, Student Edition, 9780079039897…
Algebra
ISBN:
9780079039897
Author:
Carter
Publisher:
McGraw Hill
Glencoe Algebra 1, Student Edition, 9780079039897…
Algebra
ISBN:
9780079039897
Author:
Carter
Publisher:
McGraw Hill