Use the sample data below to test the hypotheses Ho: Pi = P2 = P3 Ha : Not all population proportions are the same Populations Response 1 2 3 Yes 150 150 92 No 100 150 108 where p; is the population proportion of yes responses for population i. Using a 0.05 level of significance. a. Compute the sample proportion for each population. Round your answers to two decimal places. P1 = P2 = P3 = b. Use the multiple comparison procedure to determine which population proportions differ significantly. Use a 0.05 level of significance. Round Pi, Pj, and absolute difference to two decimal places. Use Table 3 of Appendix B. |Absolute| Critical Significant if |Diff| > Comparison Difference nj Value CV 1 vs 2 - Select your answer - v 1 vs 3 - Select your answer - v 2 vs 3 - Select your answer
Use the sample data below to test the hypotheses Ho: Pi = P2 = P3 Ha : Not all population proportions are the same Populations Response 1 2 3 Yes 150 150 92 No 100 150 108 where p; is the population proportion of yes responses for population i. Using a 0.05 level of significance. a. Compute the sample proportion for each population. Round your answers to two decimal places. P1 = P2 = P3 = b. Use the multiple comparison procedure to determine which population proportions differ significantly. Use a 0.05 level of significance. Round Pi, Pj, and absolute difference to two decimal places. Use Table 3 of Appendix B. |Absolute| Critical Significant if |Diff| > Comparison Difference nj Value CV 1 vs 2 - Select your answer - v 1 vs 3 - Select your answer - v 2 vs 3 - Select your answer

Glencoe Algebra 1, Student Edition, 9780079039897, 0079039898, 2018
18th Edition
ISBN:9780079039897
Author:Carter
Publisher:Carter
Chapter10: Statistics
Section10.4: Distributions Of Data
Problem 19PFA

Related questions
Question
Use the sample data below to test the hypotheses where p is the population proportion of yes responses for population i. Using a .05 level of significance
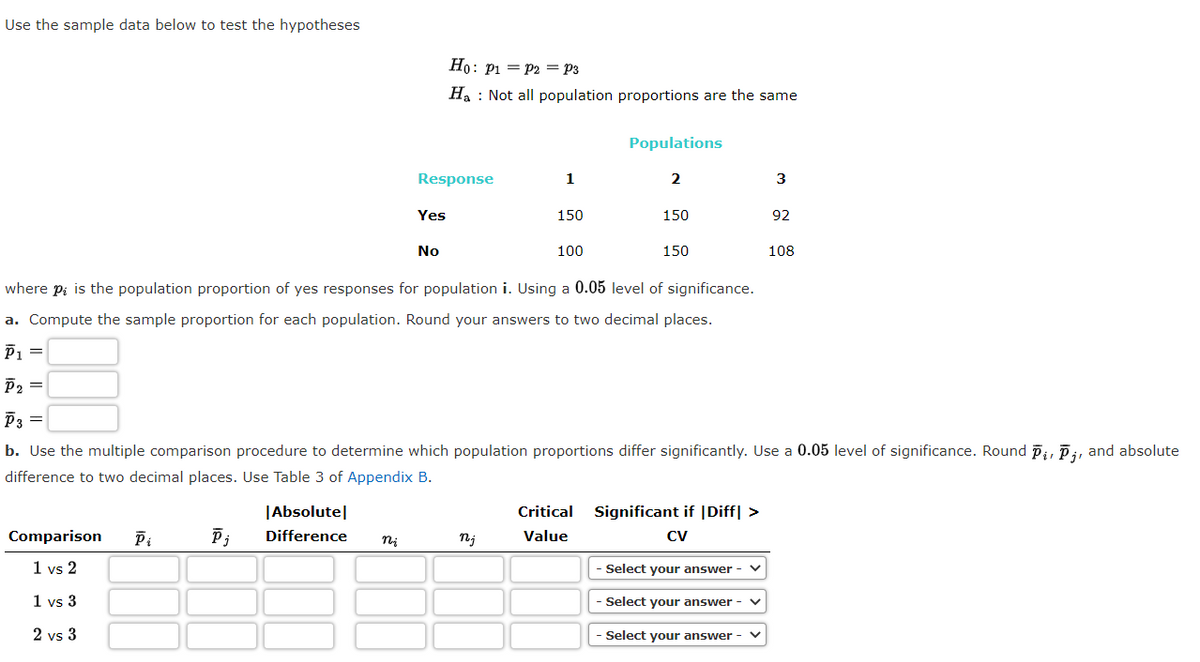
Transcribed Image Text:Use the sample data below to test the hypotheses
Ho: P1 = P2 = p3
Ha : Not all population proportions are the same
Populations
Response
1
2
Yes
150
150
92
No
100
150
108
where pi is the population proportion of yes responses for population i. Using a 0.05 level of significance.
a. Compute the sample proportion for each population. Round your answers to two decimal places.
P1 =
P2 =
P3 =
b. Use the multiple comparison procedure to determine which population proportions differ significantly. Use a 0.05 level of significance. Round pi, Pi, and absolute
difference to two decimal places. Use Table 3 of Appendix B.
|Absolute|
Critical
Significant if |Diff| >
Comparison
Difference
nj
Value
CV
1 vs 2
- Select your answer -
1 vs 3
Select your answer
2 vs 3
- Select your answer -
Expert Solution
This question has been solved!
Explore an expertly crafted, step-by-step solution for a thorough understanding of key concepts.

This is a popular solution!

Trending now
This is a popular solution!

Step by step
Solved in 2 steps with 1 images

Recommended textbooks for you
Glencoe Algebra 1, Student Edition, 9780079039897…
Algebra
ISBN:
9780079039897
Author:
Carter
Publisher:
McGraw Hill
Glencoe Algebra 1, Student Edition, 9780079039897…
Algebra
ISBN:
9780079039897
Author:
Carter
Publisher:
McGraw Hill