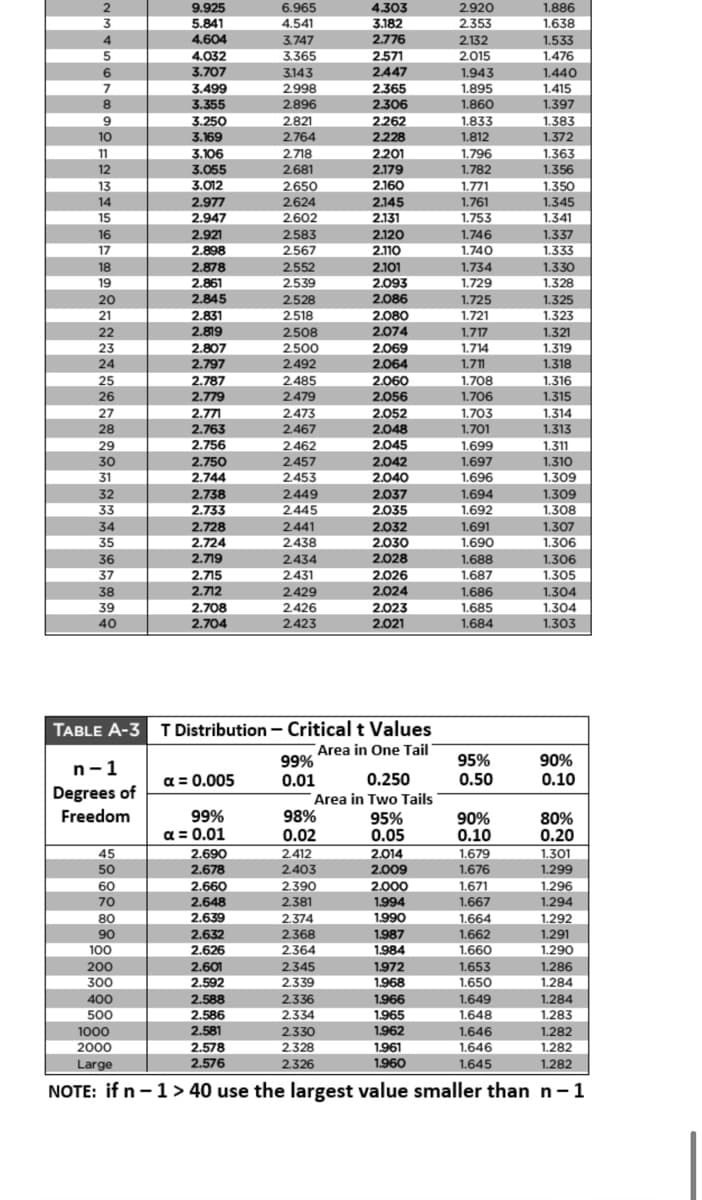
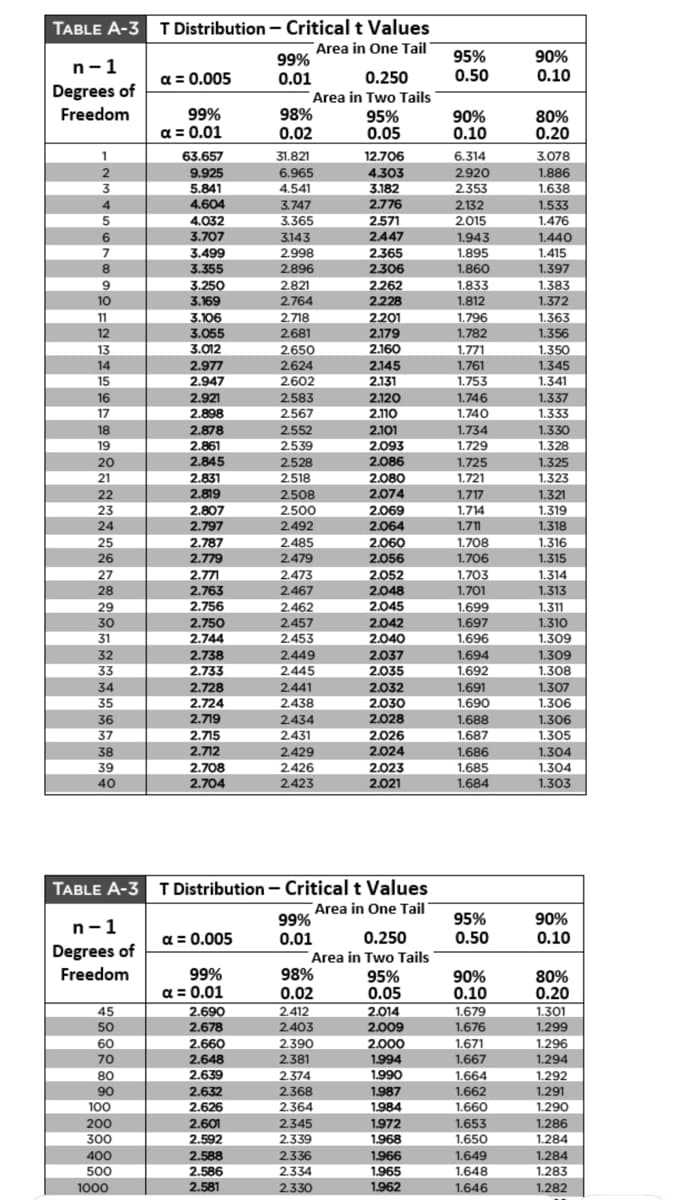
Use the T Table to find the T score that corresponds to a sample size of 15 and
a confidence level of 95% (? = 0.05) for a two-tail distribution.
(A) 1.761 (B) 2.131
(C) 2.145 (D) 2.030
Transcribed Image Text: 2445
6.965
9.925
5.841
4.604
4.032
4.303
3.182
2.776
2.920
1.886
4.541
3.747
3.365
2.353
1.638
1.533
1.476
2.132
2.015
1.943
1.895
1,860
2.571
3.707
2447
1.440
1.415
1.397
9.
3143
7
3.499
2.998
2.365
2896
2.306
2262
8.
3.355
3.250
2.821
1.833
1.383
1.372
3 169
1.812
1.796
1.782
10
3.169
2.764
2228
11
3.106
1767
2.718
2.681
2201
1.363
1.356
12
3.055
2.179
2.160
3.012
13
14
2.650
1.771
1.761
1.753
1.350
1345
2.977
2.624
2.145
15
2.947
2602
2.131
1.341
16
2.921
2.583
2.120
1.746
1.337
1.740
17
2.898
2.567
2.110
177
1.333
18
2.878
2.552
2.101
1.734
1.330
19
1.729
2.861
2.845
2.539
2.093
1.328
20
2,528
2.086
1.725
1.325
21
2.831
2518
2.080
1.721
1.323
2.819
2.508
2.500
22
2.074
1.717
1.321
1.714
2.069
2.064
23
2.807
1.319
1.318
24
2.797
2.492
1.711
2.787
2.779
2.485
2.479
2.060
2.056
25
1.708
1.706
1.316
26
1.315
27
28
2.052
2.048
2.045
2.771
2.473
1.703
1.701
1.699
1.697
1.696
1.314
1.313
2.763
2.467
29
2.756
2.462
2.457
2.453
2449
1.311
1.310
1.309
2.750
2.744
30
2.042
31
2.040
32
2.738
2.733
2.037
1.694
1.692
1.691
1.309
33
2.035
1.308
34
2.728
2.441
2.032
1.307
1.306
1.306
1.305
2479
35
2.724
2438
2.030
1.690
36
2.719
2028
2.434
2.431
2.429
2.426
2.423
1.688
37
2.715
2.026
1.687
38
2.712
2.024
1.304
1.686
1.685
39
40
2.708
2.704
1.304
1.303
2.023
2.021
1.684
TABLE A-3 T Distribution – Criticalt Values
Area in One Tail
99%
95%
0.50
90%
0.10
n-1
a = 0.005
0.01
0.250
Degrees of
Freedom
Area in Two Tails
98%
0.02
99%
a = 0.01
95%
0.05
90%
0.10
80%
0.20
2.690
2.014
45
50
2.412
2.403
2.390
2.381
1.679
1.676
1.301
1.299
2.678
2.009
60
70
2.660
2.648
2.000
1.994
1.671
1.667
1.296
1.294
2.639
1.990
80
90
100
2.374
1.664
1.292
1.291
1.290
1.286
1.284
1.284
2.632
2.368
1.987
1.984
1.662
2.626
2364
1.660
2.601
2.592
1.972
1.653
1.650
200
2.345
300
2.339
1.968
2.588
2.586
1.966
400
500
1000
2000
Large
2.336
1.649
2.334
1.965
1.646
1.648
1.283
1.646
1.646
2.581
1.962
1.282
2.330
2.328
2.326
1.961
1.960
1.282
2.578
2.576
1.645
1.282
NOTE: if n-1 > 40 use the largest value smaller than n- 1
Transcribed Image Text: TABLE A-3 T Distribution – Critical t Values
Area in One Tail
99%
0.01
Area in Two Tails
98%
0.02
95%
0.50
90%
0.10
n-1
a = 0.005
0.250
Degrees of
Freedom
99%
95%
0.05
90%
0.10
80%
0.20
a = 0.01
1
63.657
31.821
6.965
4.541
3.747
3.365
12.706
6.314
2.920
2.353
3.078
4.303
3.182
2
9.925
1.886
1.638
1.533
1.476
3
5.841
4
4.604
2.776
2.132
4.032
3.707
3.499
3.355
2.571
2.015
2447
1.943
1.895
3.143
1.440
1.415
1.945
2.998
2.365
8.
2.896
2.306
1.860
1.397
9
1.833
2262
2228
1.383
1.372
3.250
2.821
2.764
10
3.169
1.812
3.106
3.055
2.718
2.681
2201
2.179
1.796
1.363
1.356
11
12
1.782
2650
2.624
13
3.012
2.160
1.350
2.977
2.947
1.771
1.761
1.753
14
2.145
2.131
1.345
1.341
2.602
2.583
2.567
15
16
2.921
2.120
2.110
1.746
1.337
17
2.898
1.740
1.333
18
2.101
2.878
2.861
2.552
1.734
1.330
2.539
1.754
1.729
1.328
19
2.093
2.845
2 831
20
2.528
2.086
1.725
1721
1.325
1323
21
2.831
2518
2.518
2.080
2.819
1.717
22
23
2.508
2.500
2.492
2.074
1.321
2.807
2 707
2.069
2.064
1.714
1.711
1.319
24
2.797
1.318
1.318
1.708
1715
25
26
2.787
2.485
2.479
2.473
2.467
2.060
1.316
2.779
2.056
1.706
1 715
1.315
27
2.052
2.048
1.703
1.314
1.313
2.771
28
2.763
2.756
1.701
2.045
29
30
2.462
2.457
2453
1.699
1.697
1.311
1.310
1.309
1.309
1.308
2.750
2.042
31
32
33
2.744
2.040
1.696
1.694
2.738
2.449
2.037
L604
1700
2.733
2.445
2.035
1.692
34
2.441
2.728
2.724
2 79
2.032
1.691
1.690
1.307
1.306
1.306
35
2.438
2.030
2.719
2.028
36
37
2.434
1.688
2.715
2.712
2.708
2.704
2.431
2.026
2.024
1.687
1.305
2.429
2.426
2.423
1.304
1.304
1.303
38
1.686
1.685
39
40
2.023
2.021
1.684
TABLE A-3 T Distribution - Critical t Values
Area in One Tail
99%
95%
0.50
90%
n-1
a = 0.005
0.250
0.10
0.01
Area in Two Tails
98%
0.02
Degrees of
Freedom
99%
a = 0.01
2.690
95%
0.05
90%
0.10
1.679
80%
0.20
1.301
1.299
1.296
45
50
60
2.412
2.403
2.390
2.014
2.009
2.678
1.676
2.660
2.648
2.639
2.000
1.671
1.667
70
2.381
1.994
1.990
1.294
80
2.374
1.664
1.292
1.292
1.291
90
2.632
2.626
2.368
1.987
1.984
1.662
100
2.364
1.660
1.290
200
2.345
300
2.601
2.592
1.972
1.968
1.653
1.650
1.286
1.284
2.339
1.649
1.648
400
2.588
2.336
2.334
1.966
1.284
500
1.965
1.283
2.586
2.581
1000
2.330
1.962
1.646
1.282
Definition Definition Number of subjects or observations included in a study. A large sample size typically provides more reliable results and better representation of the population. As sample size and width of confidence interval are inversely related, if the sample size is increased, the width of the confidence interval decreases.
Expert Solution
This question has been solved!
Explore an expertly crafted, step-by-step solution for a thorough understanding of key concepts.
This is a popular solution!
Trending now
This is a popular solution!
Step by step
Solved in 2 steps with 1 images