Use the value of the linear correlation coefficient to calculate the coefficient of determination. What does this tell you about the explained variation of the data about the regression line? About the unexplained variation? -0.538 Calculate the coefficient of determination. (Round to three decimal places as needed.) What does this tell you about the explained variation of the data about the regression line? % of the variation can be explained by the regression line. (Round to one decimal place as needed.) About the unexplained variation? % of the variation is unexplained and is due to other factors or to sampling error. (Round to one decimal place as needed.)
Use the value of the linear correlation coefficient to calculate the coefficient of determination. What does this tell you about the explained variation of the data about the regression line? About the unexplained variation? -0.538 Calculate the coefficient of determination. (Round to three decimal places as needed.) What does this tell you about the explained variation of the data about the regression line? % of the variation can be explained by the regression line. (Round to one decimal place as needed.) About the unexplained variation? % of the variation is unexplained and is due to other factors or to sampling error. (Round to one decimal place as needed.)

Glencoe Algebra 1, Student Edition, 9780079039897, 0079039898, 2018
18th Edition
ISBN:9780079039897
Author:Carter
Publisher:Carter
Chapter4: Equations Of Linear Functions
Section4.6: Regression And Median-fit Lines
Problem 22PFA

Related questions
Question
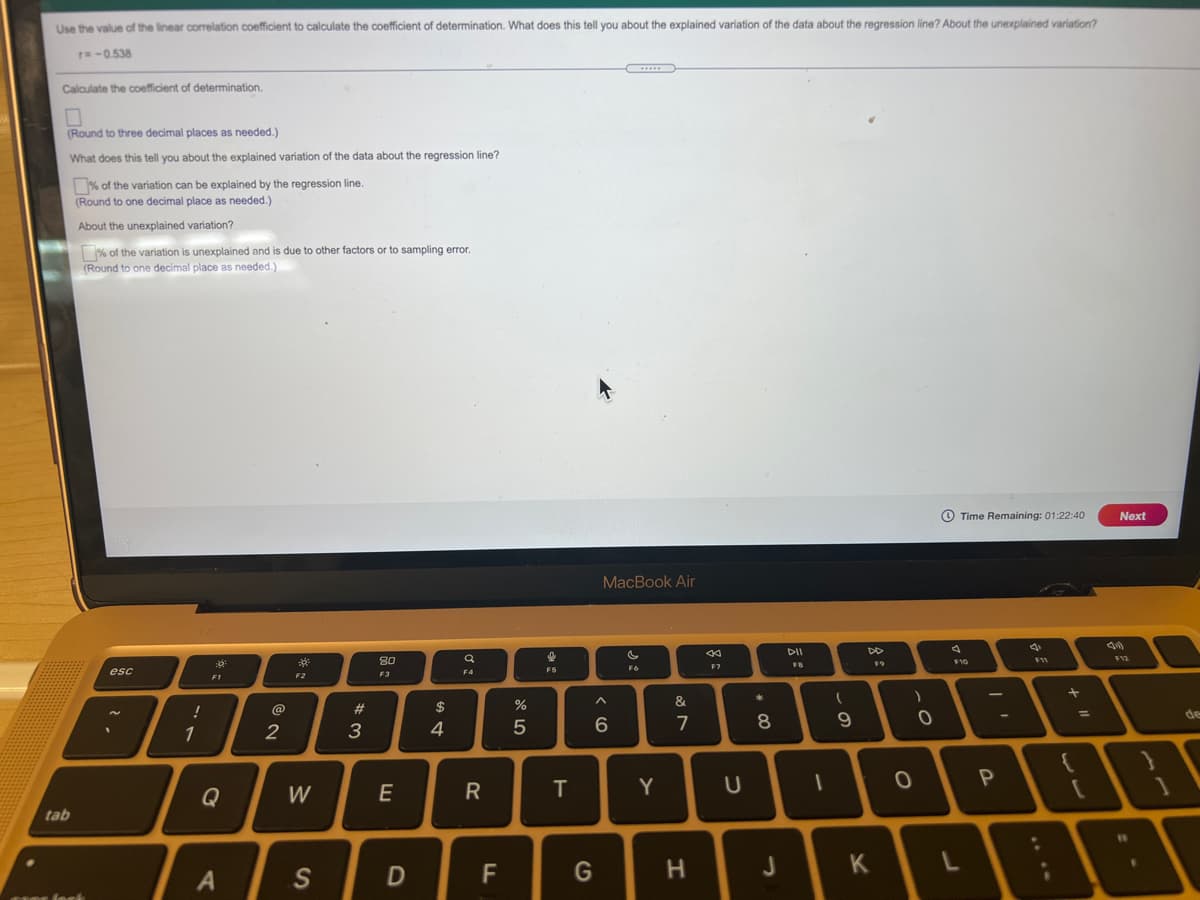
Transcribed Image Text:Use the value of the linear correlation coefficient to calculate the coefficient of determination. What does this tell you about the explained variation of the data about the regression line? About the unexplained variation?
T-0.538
Calculate the coefficient of determination.
(Round to three decimal places as needed.)
What does this tell you about the explained variation of the data about the regression line?
% of the variation can be explained by the regression line.
(Round to one decimal place as needed.)
About the unexplained variation?
% of the variation is unexplained and is due to other factors or to sampling error.
(Round to one decimal place as needed.)
O Time Remaining: 01:22:40
Next
MacBook Air
DI
80
F7
FB
esc
F5
F6
F2
@
#
$
%3D
de
2
3
4
5
7
8
9
1
P
Q
W
R
T
Y
tab
11
F
G
K
Expert Solution
This question has been solved!
Explore an expertly crafted, step-by-step solution for a thorough understanding of key concepts.

This is a popular solution!

Trending now
This is a popular solution!

Step by step
Solved in 4 steps with 4 images

Recommended textbooks for you
Glencoe Algebra 1, Student Edition, 9780079039897…
Algebra
ISBN:
9780079039897
Author:
Carter
Publisher:
McGraw Hill

Functions and Change: A Modeling Approach to Coll…
Algebra
ISBN:
9781337111348
Author:
Bruce Crauder, Benny Evans, Alan Noell
Publisher:
Cengage Learning

College Algebra
Algebra
ISBN:
9781305115545
Author:
James Stewart, Lothar Redlin, Saleem Watson
Publisher:
Cengage Learning
Glencoe Algebra 1, Student Edition, 9780079039897…
Algebra
ISBN:
9780079039897
Author:
Carter
Publisher:
McGraw Hill
Functions and Change: A Modeling Approach to Coll…
Algebra
ISBN:
9781337111348
Author:
Bruce Crauder, Benny Evans, Alan Noell
Publisher:
Cengage Learning
College Algebra
Algebra
ISBN:
9781305115545
Author:
James Stewart, Lothar Redlin, Saleem Watson
Publisher:
Cengage Learning

Algebra and Trigonometry (MindTap Course List)
Algebra
ISBN:
9781305071742
Author:
James Stewart, Lothar Redlin, Saleem Watson
Publisher:
Cengage Learning

Big Ideas Math A Bridge To Success Algebra 1: Stu…
Algebra
ISBN:
9781680331141
Author:
HOUGHTON MIFFLIN HARCOURT
Publisher:
Houghton Mifflin Harcourt