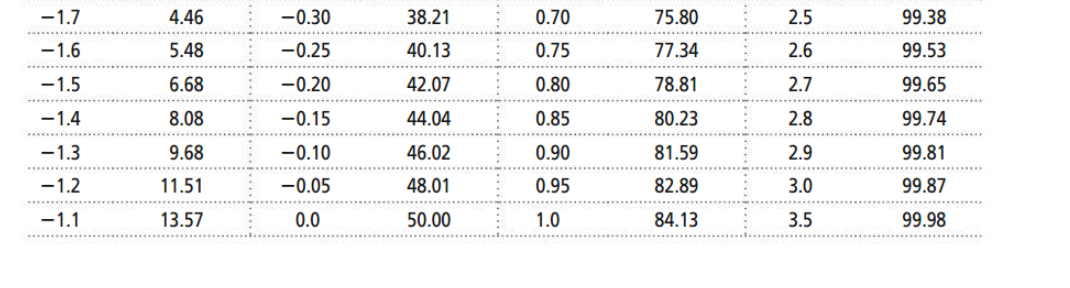
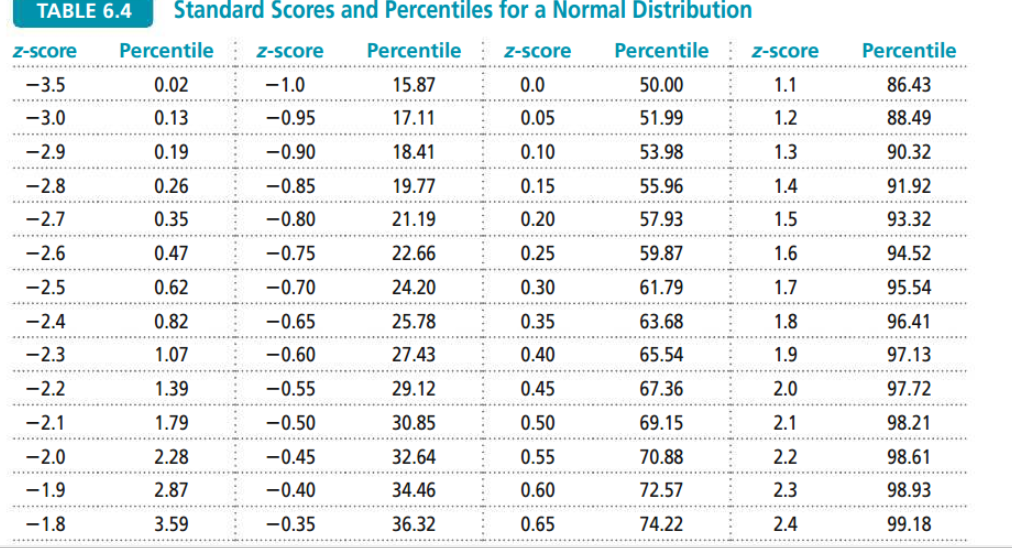
Use the Z-score formula given below Zscore=data - mean standard deviation It has been determined that the mean task completion times for making fan belts at an auto parts manufacturing facility is 30 minutes. The times are normally distributed with a standard deviation of 2 minutes; a. What percent of belts will take less than 33 minutes to produce? b. What percent of fans will take more than 29 minutes to produce?


Inverse Normal Distribution
The method used for finding the corresponding z-critical value in a normal distribution using the known probability is said to be an inverse normal distribution. The inverse normal distribution is a continuous probability distribution with a family of two parameters.
Mean, Median, Mode
It is a descriptive summary of a data set. It can be defined by using some of the measures. The central tendencies do not provide information regarding individual data from the dataset. However, they give a summary of the data set. The central tendency or measure of central tendency is a central or typical value for a probability distribution.
Z-Scores
A z-score is a unit of measurement used in statistics to describe the position of a raw score in terms of its distance from the mean, measured with reference to standard deviation from the mean. Z-scores are useful in statistics because they allow comparison between two scores that belong to different normal distributions.
Use the Z-score formula given below
Zscore=data -
standard deviation
It has been determined that the mean task completion times for making fan belts at an auto parts manufacturing facility is 30 minutes. The times are
a. What percent of belts will take less than 33 minutes to produce?
b. What percent of fans will take more than 29 minutes to produce?


Trending now
This is a popular solution!

Step by step
Solved in 2 steps with 1 images


