Use the z-Table for the standard normal distribution [see Lecture Notes] to calculate the following probabilities: No.9-C1. At zo = -0.96; Z1 = 0. 7 Probabilities Answers (see Form) P(Z < zo) P(Z > z1) P(|Z| < z1)
Use the z-Table for the standard normal distribution [see Lecture Notes] to calculate the following probabilities: No.9-C1. At zo = -0.96; Z1 = 0. 7 Probabilities Answers (see Form) P(Z < zo) P(Z > z1) P(|Z| < z1)

A First Course in Probability (10th Edition)
10th Edition
ISBN:9780134753119
Author:Sheldon Ross
Publisher:Sheldon Ross
Chapter1: Combinatorial Analysis
Section: Chapter Questions
Problem 1.1P: a. How many different 7-place license plates are possible if the first 2 places are for letters and...

Related questions

Question
Please solve
![Use the z-Table for the standard normal distribution [see Lecture Notes] to
calculate the following probabilities:
No.9-C1.
At zo = -0.96;
Z1 = 0.7
Probabilities
Answers (see Form)
P(Z < zo)
P(Z > z1)
P(|Z| < z1)
P(z, < Z < z1)
Use the z-Table for the standard normal distribution [see Lecture Notes] to find
z so that 6% of the standard normal curve lies to the right of z.
No.9-C2.
No.9-С3.
Use the z-Table for the standard normal distribution [see Lecture Notes] to find
the value a for the P(-a <Z <a) = 0.6.
Calculate the value of a in the standard normal distribution for which
P(-4 – a <Z < 4 + a) = 0.5934.
No.9-C4.
No.9-C5.
Let X is a normally distributed variable with mean u = 266 and standard
deviation o = 16. Find
а) Р(х < 250);
b) Р(X > 300);
c) P(240 < X < 270).](/v2/_next/image?url=https%3A%2F%2Fcontent.bartleby.com%2Fqna-images%2Fquestion%2F6e267ed1-910d-45b5-8c88-ff3c3ad7ba91%2Fd3f9f675-1a20-426f-8888-1a1b3403b288%2F6f18mka_processed.png&w=3840&q=75)
Transcribed Image Text:Use the z-Table for the standard normal distribution [see Lecture Notes] to
calculate the following probabilities:
No.9-C1.
At zo = -0.96;
Z1 = 0.7
Probabilities
Answers (see Form)
P(Z < zo)
P(Z > z1)
P(|Z| < z1)
P(z, < Z < z1)
Use the z-Table for the standard normal distribution [see Lecture Notes] to find
z so that 6% of the standard normal curve lies to the right of z.
No.9-C2.
No.9-С3.
Use the z-Table for the standard normal distribution [see Lecture Notes] to find
the value a for the P(-a <Z <a) = 0.6.
Calculate the value of a in the standard normal distribution for which
P(-4 – a <Z < 4 + a) = 0.5934.
No.9-C4.
No.9-C5.
Let X is a normally distributed variable with mean u = 266 and standard
deviation o = 16. Find
а) Р(х < 250);
b) Р(X > 300);
c) P(240 < X < 270).
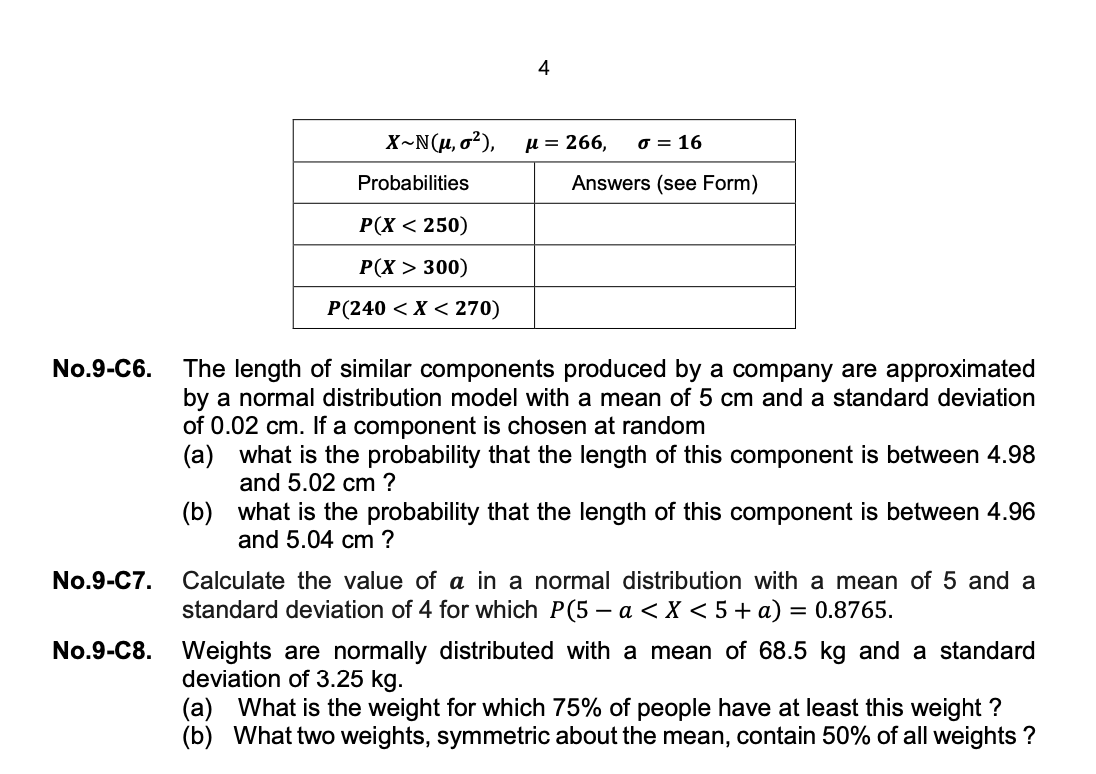
Transcribed Image Text:4
X~N(µ, o²),
µ = 266,
o = 16
Probabilities
Answers (see Form)
Р(X < 250)
Р(X > 300)
P(240 < X < 270)
No.9-C6.
The length of similar components produced by a company are approximated
by a normal distribution model with a mean of 5 cm and a standard deviation
of 0.02 cm. If a component is chosen at random
(a) what is the probability that the length of this component is between 4.98
and 5.02 cm ?
(b) what is the probability that the length of this component is between 4.96
and 5.04 cm ?
No.9-C7.
Calculate the value of a in a normal distribution with a mean of 5 and a
standard deviation of 4 for which P(5 – a <X < 5+a) = 0.8765.
No.9-C8.
Weights are normally distributed with a mean of 68.5 kg and a standard
deviation of 3.25 kg.
(a) What is the weight for which 75% of people have at least this weight ?
(b) What two weights, symmetric about the mean, contain 50% of all weights ?
Expert Solution
This question has been solved!
Explore an expertly crafted, step-by-step solution for a thorough understanding of key concepts.

This is a popular solution!

Trending now
This is a popular solution!

Step by step
Solved in 3 steps with 3 images

Knowledge Booster


Learn more about
Need a deep-dive on the concept behind this application? Look no further. Learn more about this topic, probability and related others by exploring similar questions and additional content below.Recommended textbooks for you
A First Course in Probability (10th Edition)
Probability
ISBN:
9780134753119
Author:
Sheldon Ross
Publisher:
PEARSON

A First Course in Probability (10th Edition)
Probability
ISBN:
9780134753119
Author:
Sheldon Ross
Publisher:
PEARSON