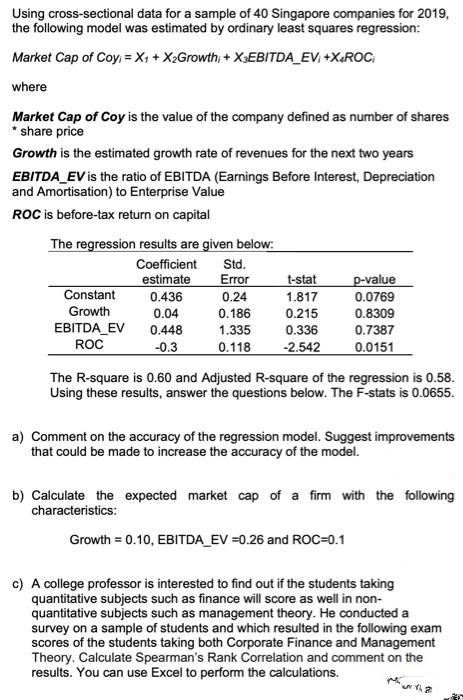
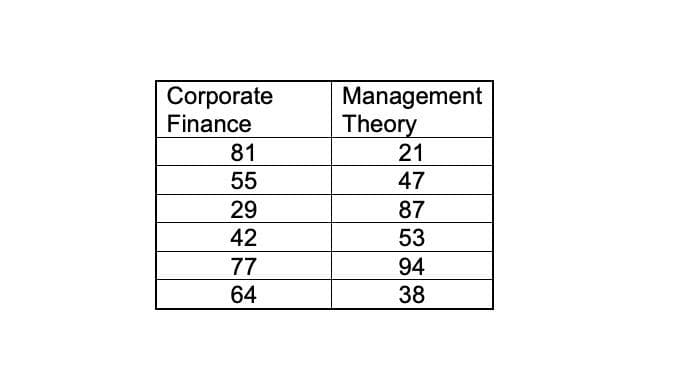
Using cross-sectional data for a sample of 40 Singapore companies for 2019, the following model was estimated by ordinary least squares regression: Market Cap of Coy, = X₁ + X₂Growth; + XEBITDA_EV+X+ROC where Market Cap of Coy is the value of the company defined as number of shares *share price Growth is the estimated growth rate of revenues for the next two years EBITDA EV is the ratio of EBITDA (Earnings Before Interest, Depreciation and Amortisation) to Enterprise Value ROC is before-tax return on capital The regression results are given below: Coefficient Std. estimate Error Constant Growth EBITDA_EV ROC 0.436 0.04 0.448 -0.3 t-stat 1.817 0.215 0.336 0.118 -2.542 0.24 0.186 1.335 p-value 0.0769 0.8309 0.7387 0.0151 The R-square is 0.60 and Adjusted R-square of the regression is 0.58. Using these results, answer the questions below. The F-stats is 0.0655. a) Comment on the accuracy of the regression model. Suggest improvements that could be made to increase the accuracy of the model. b) Calculate the expected market cap of a firm with the following characteristics: Growth = 0.10, EBITDA_EV =0.26 and ROC=0.1 c) A college professor is interested to find out if the students taking quantitative subjects such as finance will score as well in non- quantitative subjects such as management theory. He conducted a survey on a sample of students and which resulted in the following exam scores of the students taking both Corporate Finance and Management Theory. Calculate Spearman's Rank Correlation and comment on the results. You can use Excel to perform the calculations.
Using cross-sectional data for a sample of 40 Singapore companies for 2019, the following model was estimated by ordinary least squares regression: Market Cap of Coy, = X₁ + X₂Growth; + XEBITDA_EV+X+ROC where Market Cap of Coy is the value of the company defined as number of shares *share price Growth is the estimated growth rate of revenues for the next two years EBITDA EV is the ratio of EBITDA (Earnings Before Interest, Depreciation and Amortisation) to Enterprise Value ROC is before-tax return on capital The regression results are given below: Coefficient Std. estimate Error Constant Growth EBITDA_EV ROC 0.436 0.04 0.448 -0.3 t-stat 1.817 0.215 0.336 0.118 -2.542 0.24 0.186 1.335 p-value 0.0769 0.8309 0.7387 0.0151 The R-square is 0.60 and Adjusted R-square of the regression is 0.58. Using these results, answer the questions below. The F-stats is 0.0655. a) Comment on the accuracy of the regression model. Suggest improvements that could be made to increase the accuracy of the model. b) Calculate the expected market cap of a firm with the following characteristics: Growth = 0.10, EBITDA_EV =0.26 and ROC=0.1 c) A college professor is interested to find out if the students taking quantitative subjects such as finance will score as well in non- quantitative subjects such as management theory. He conducted a survey on a sample of students and which resulted in the following exam scores of the students taking both Corporate Finance and Management Theory. Calculate Spearman's Rank Correlation and comment on the results. You can use Excel to perform the calculations.

Linear Algebra: A Modern Introduction
4th Edition
ISBN:9781285463247
Author:David Poole
Publisher:David Poole
Chapter7: Distance And Approximation
Section7.3: Least Squares Approximation
Problem 31EQ

Related questions
Question
Pls do ASAP ... I WILL GIVE LIKE FOR SURE
Try to give solution in typed form
Transcribed Image Text:Using cross-sectional data for a sample of 40 Singapore companies for 2019,
the following model was estimated by ordinary least squares regression:
Market Cap of Coy=X₁ + X₂Growth; +
X3EBITDA_EV₁+X+ROC
where
Market Cap of Coy is the value of the company defined as number of shares
* share price
Growth is the estimated growth rate of revenues for the next two years
EBITDA_EV is the ratio of EBITDA (Earnings Before Interest, Depreciation
and Amortisation) to Enterprise Value
ROC is before-tax return on capital
The regression results are given below:
Coefficient
estimate
Constant
Growth
EBITDA_EV
ROC
0.436
0.04
0.448
-0.3
Std.
Error
t-stat
1.817
0.215
0.336
0.24
0.186
1.335
0.118 -2.542
p-value
0.0769
0.8309
0.7387
0.0151
The R-square is 0.60 and Adjusted R-square of the regression is 0.58.
Using these results, answer the questions below. The F-stats is 0.0655.
a) Comment on the accuracy of the regression model. Suggest improvements
that could be made to increase the accuracy of the model.
b) Calculate the expected market cap of a firm with the following
characteristics:
Growth = 0.10, EBITDA_EV =0.26 and ROC=0.1
c) A college professor is interested to find out if the students taking
quantitative subjects such as finance will score as well in non-
quantitative subjects such as management theory. He conducted a
survey on a sample of students and which resulted in the following exam
scores of the students taking both Corporate Finance and Management
Theory. Calculate Spearman's Rank Correlation and comment on the
results. You can use Excel to perform the calculations.
M
un 1, 2
Transcribed Image Text:Corporate
Finance
81
55
29
42
77
64
Management
Theory
21
47
87
53
94
38
Expert Solution
This question has been solved!
Explore an expertly crafted, step-by-step solution for a thorough understanding of key concepts.

Step by step
Solved in 4 steps

Recommended textbooks for you
Linear Algebra: A Modern Introduction
Algebra
ISBN:
9781285463247
Author:
David Poole
Publisher:
Cengage Learning
Linear Algebra: A Modern Introduction
Algebra
ISBN:
9781285463247
Author:
David Poole
Publisher:
Cengage Learning