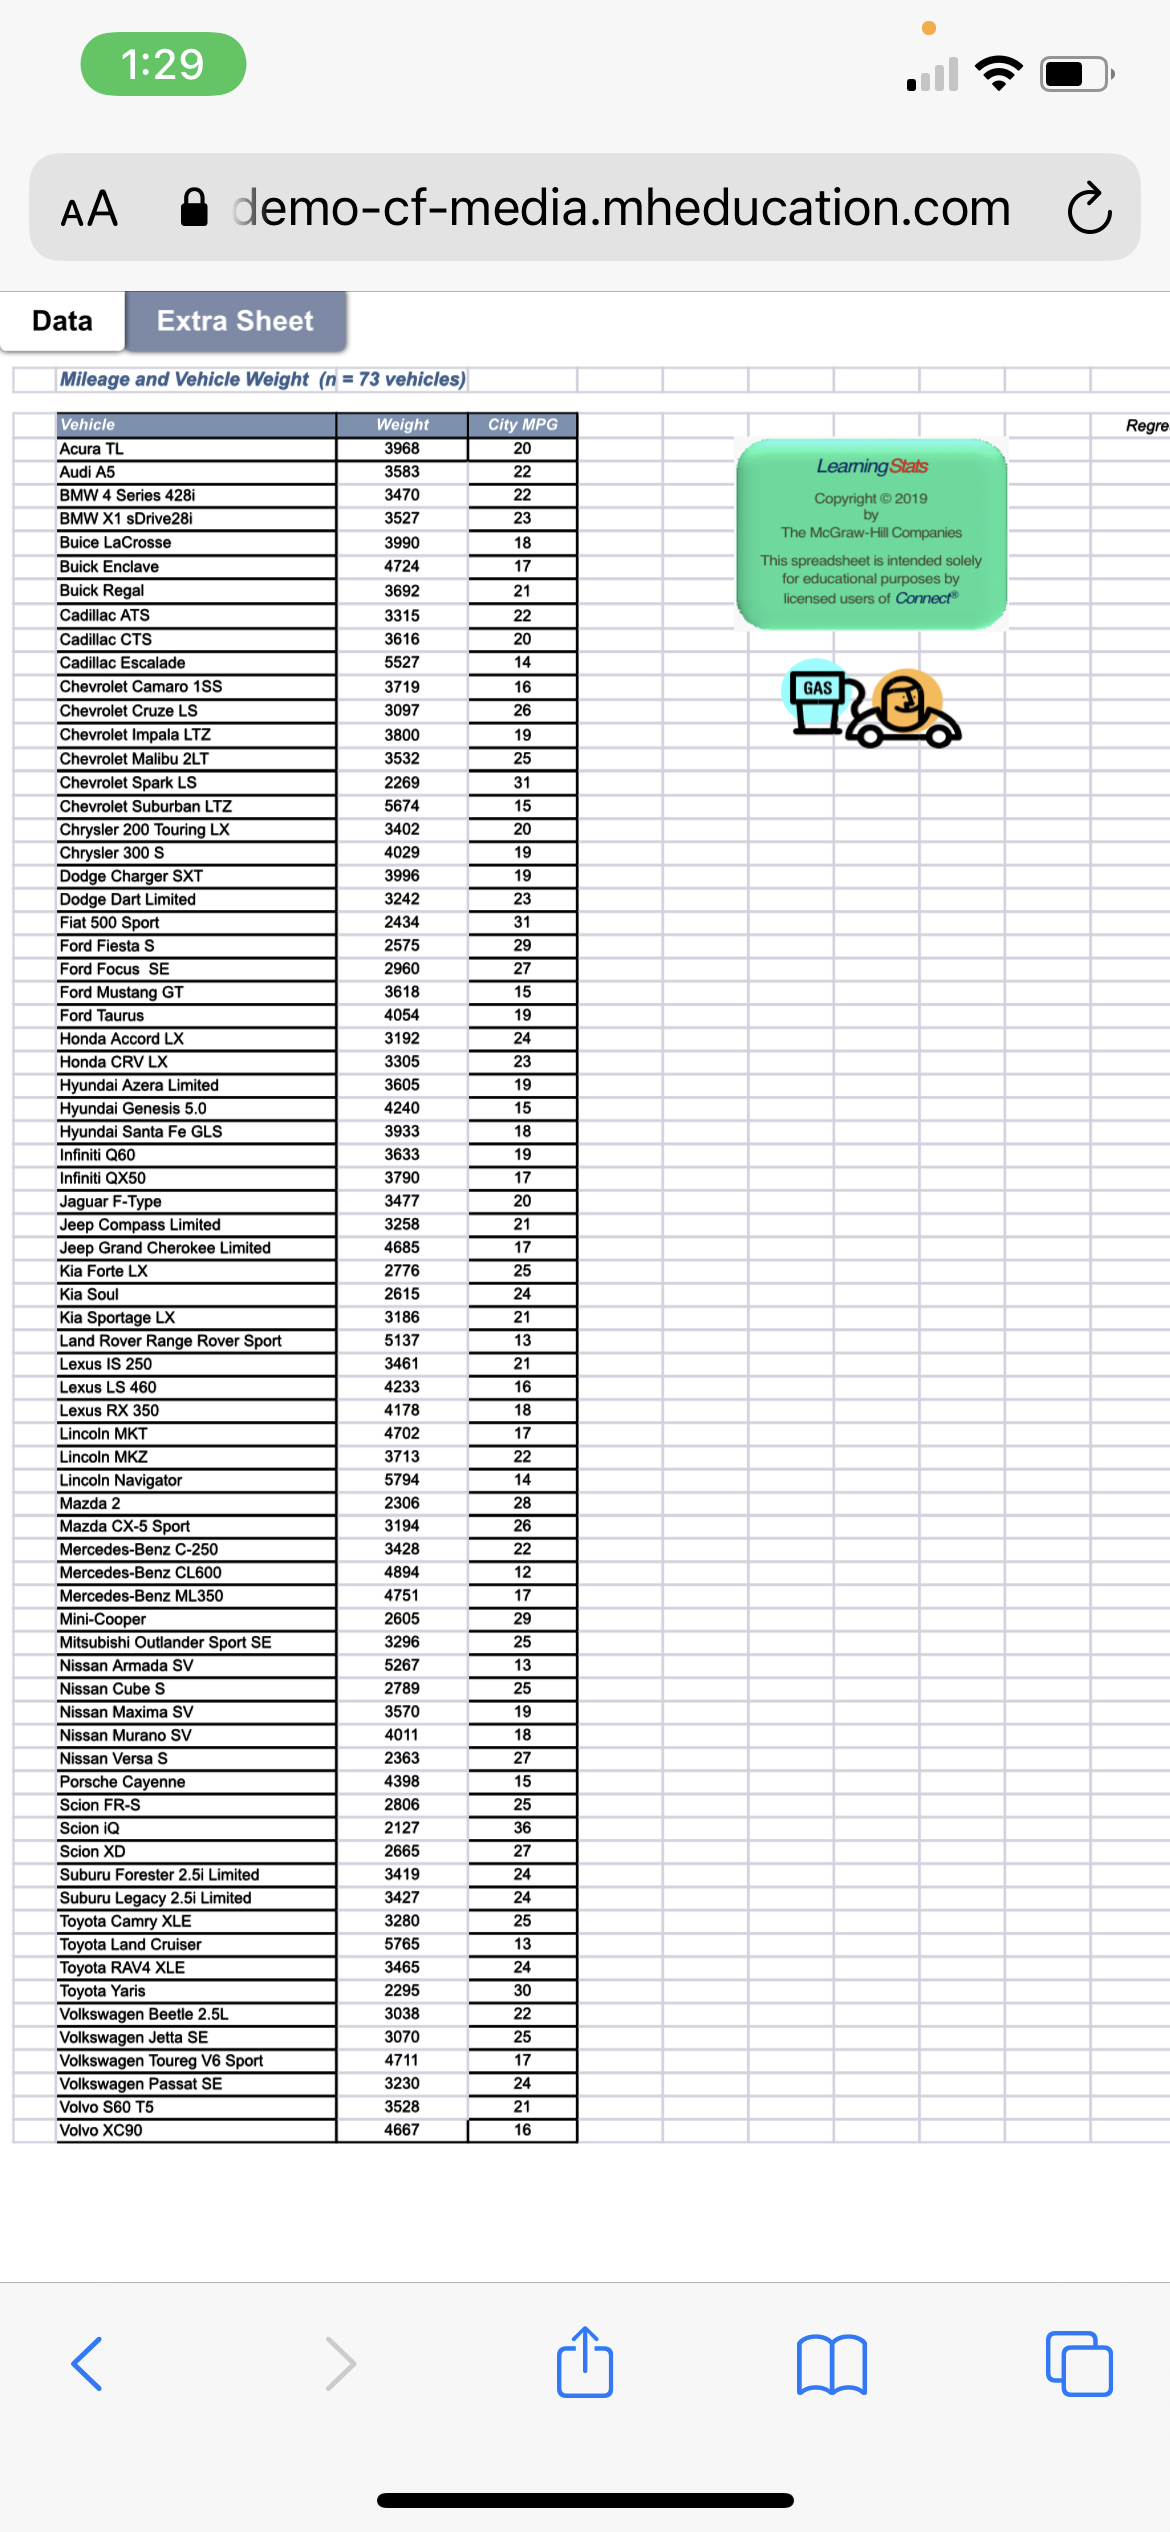
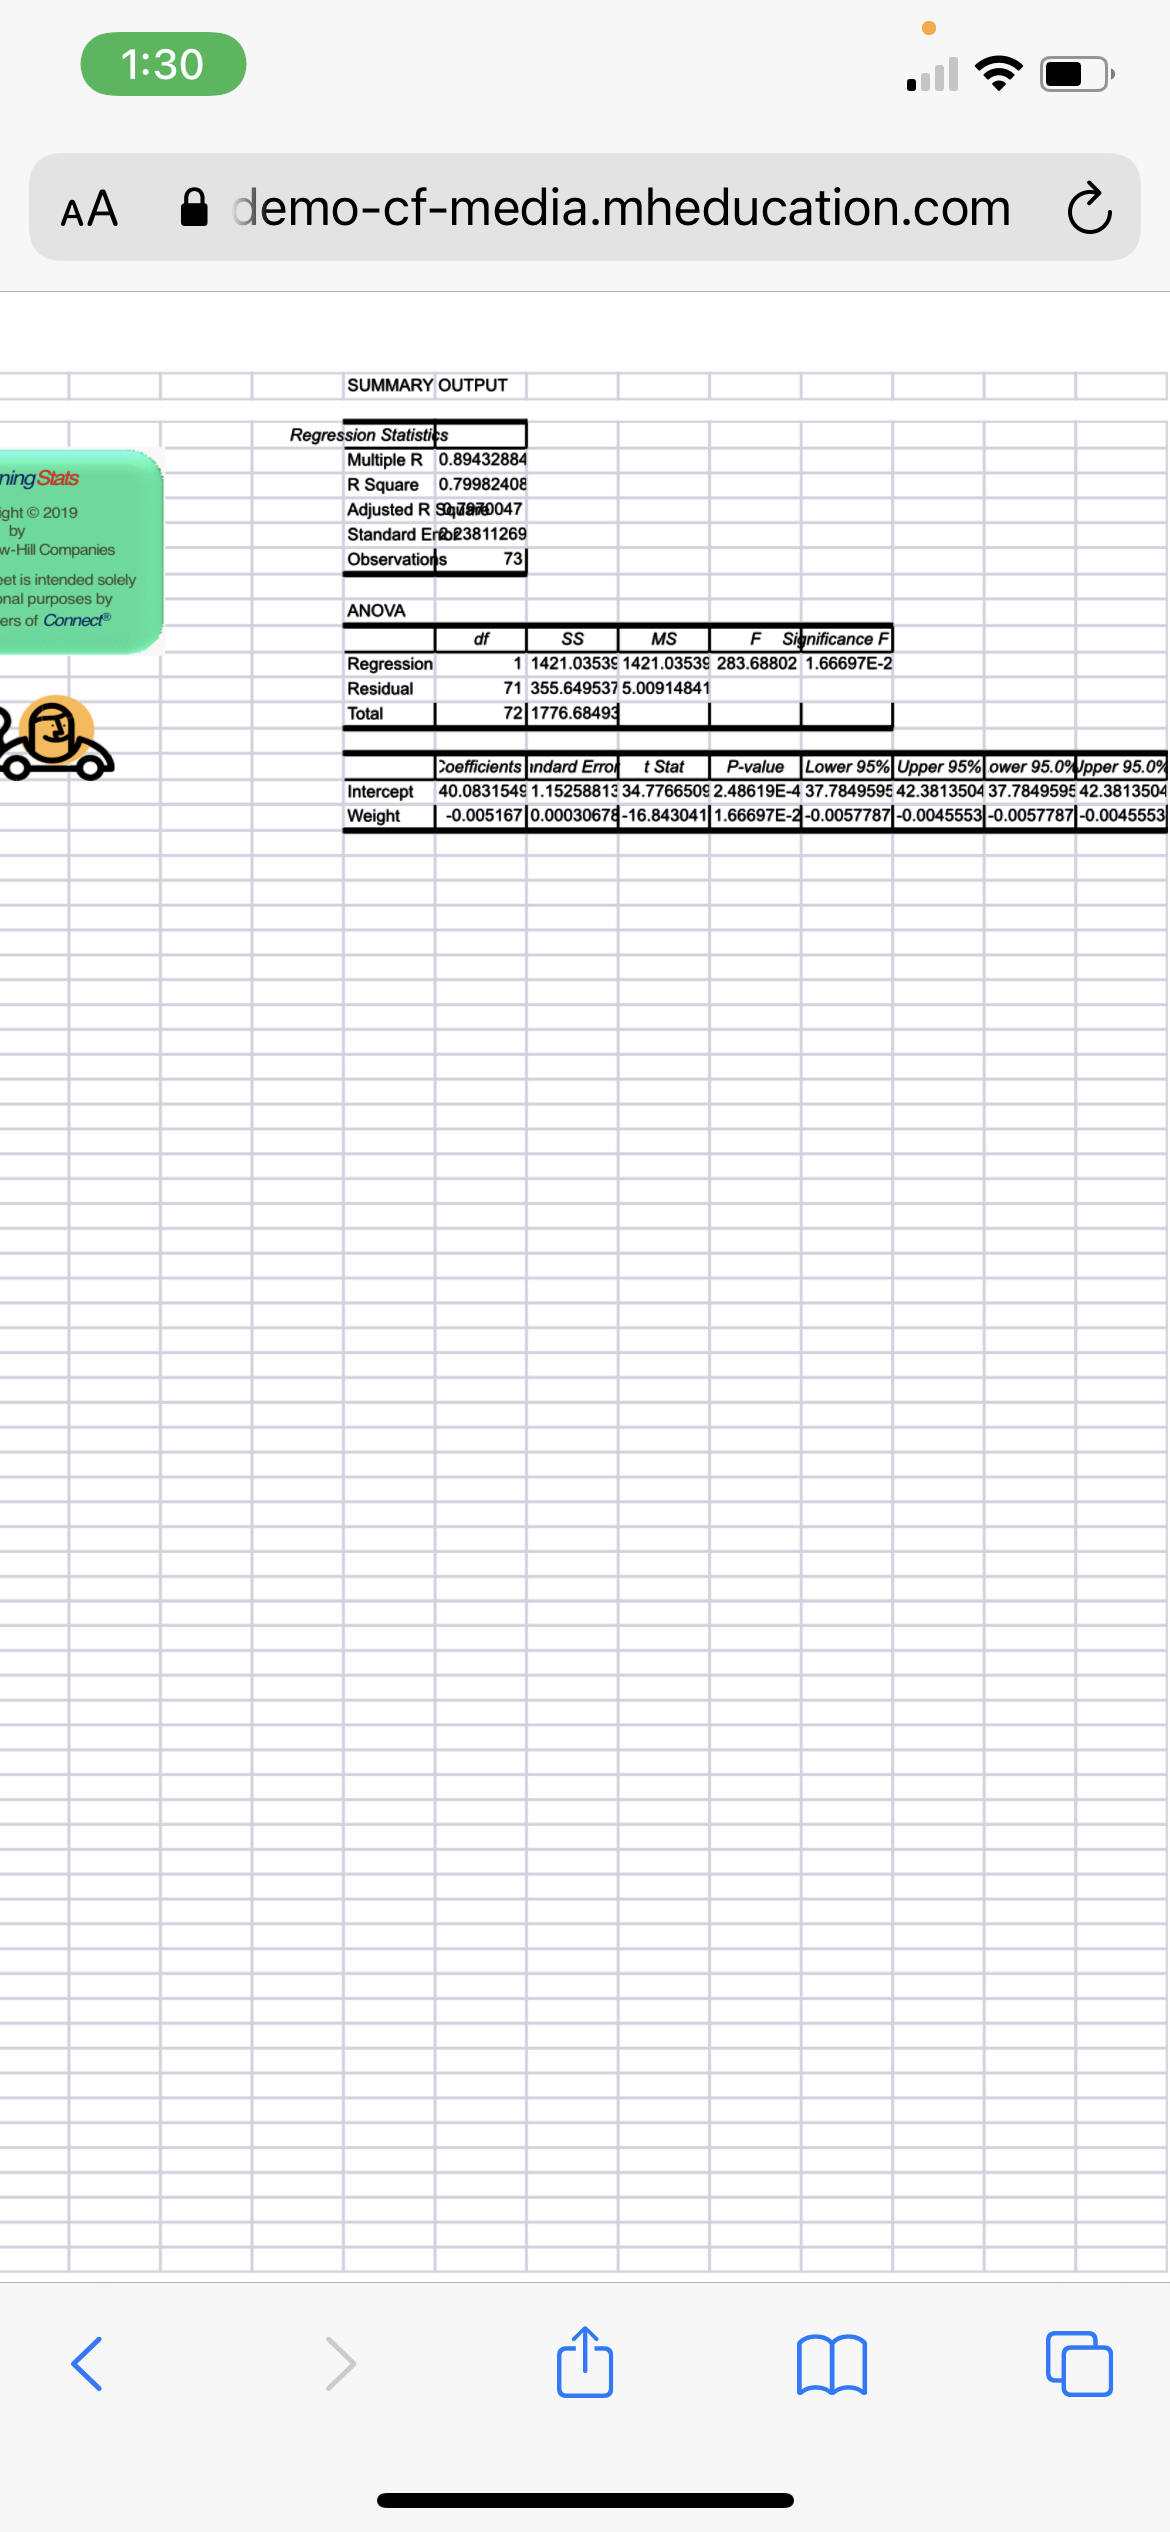
Using Data set G in the pictures, calculate R2, and calculate t-critical. a=5.05

Linear Algebra: A Modern Introduction
4th Edition
ISBN:9781285463247
Author:David Poole
Publisher:David Poole
Chapter2: Systems Of Linear Equations
Section2.4: Applications
Problem 1EQ: 1. Suppose that, in Example 2.27, 400 units of food A, 600 units of B, and 600 units of C are placed...

Related questions
Question
Using Data set G in the pictures, calculate R2, and calculate t-critical. a=5.05
Transcribed Image Text:1:29
AA
A demo-cf-media.mheducation.com
Data
Extra Sheet
Mileage and Vehicle Weight (n = 73 vehicles)
Vehicle
Weight
City MPG
Regre
Acura TL
3968
20
Audi A5
3583
22
Leaming Stats
BMW 4 Series 428i
3470
22
Copyright© 2019
by
The McGraw-Hill Companies
BMW X1 sDrive28i
3527
23
Buice LaCrosse
3990
18
This spreadsheet is intended solely
for educational purposes by
licensed users of Connect
Buick Enclave
4724
17
Buick Regal
3692
21
Cadillac ATS
3315
22
Cadillac CTS
3616
20
Cadillac Escalade
5527
14
Chevrolet Camaro 1SS
3719
16
GAS
Chevrolet Cruze LS
3097
26
Chevrolet Impala LTZ
3800
19
Chevrolet Malibu 2LT
3532
25
Chevrolet Spark LS
2269
31
Chevrolet Suburban LTZ
5674
15
Chrysler 200 Touring LX
Chrysler 300 S
Dodge Charger SXT
Dodge Dart Limited
Fiat 500 Sport
3402
20
4029
19
3996
19
3242
23
2434
31
Ford Fiesta S
2575
29
Ford Focus SE
2960
27
Ford Mustang GT
3618
15
Ford Taurus
4054
19
Honda Accord LX
3192
24
Honda CRV LX
3305
23
Hyundai Azera Limited
Hyundai Genesis 5.0
3605
19
4240
15
Hyundai Santa Fe GLS
Infiniti Q60
3933
18
3633
19
Infiniti QX50
3790
17
Jaguar F-Type
Jeep Compass Limited
Jeep Grand Cherokee Limited
3477
20
3258
21
4685
17
Kia Forte LX
2776
25
Kia Soul
2615
24
Kia Sportage LX
Land Rover Range Rover Sport
Lexus IS 250
3186
21
5137
13
3461
21
Lexus LS 460
4233
16
Lexus RX 350
4178
18
Lincoln MKT
4702
17
Lincoln MKZ
3713
22
Lincoln Navigator
5794
14
Mazda 2
2306
28
Mazda CX-5 Sport
3194
26
Mercedes-Benz C-250
3428
22
Mercedes-Benz CL600
4894
12
Mercedes-Benz ML350
4751
17
Mini-Cooper
2605
29
Mitsubishi Outlander Sport SE
3296
25
Nissan Armada SV
5267
13
Nissan Cube S
2789
25
Nissan Maxima SV
3570
19
Nissan Murano SV
4011
18
Nissan Versa S
2363
27
Porsche Cayenne
Scion FR-S
4398
15
2806
25
Scion iQ
2127
36
Scion XD
2665
27
Suburu Forester 2.5i Limited
3419
24
24
Suburu Legacy 2.5i Limited
Toyota Camry XLE
Toyota Land Cruiser
Toyota RAV4 XLE
Toyota Yaris
Volkswagen Beetle 2.5L
Volkswagen Jetta SE
Volkswagen Toureg V6 Sport
Volkswagen Passat SE
3427
3280
25
5765
13
3465
24
2295
30
3038
22
3070
25
4711
17
3230
24
Volvo S60 T5
3528
21
Volvo XC90
4667
16
Transcribed Image Text:1:30
AA
A demo-cf-media.mheducation.com
SUMMARY OUTPUT
Regression Statistics
Multiple R 0.89432884
ning Stats
R Square 0.79982408
Adjusted R Sqūa70047
ight © 2019
by
w-Hill Companies
Standard Ero23811269
Observations
73
eet is intended solely
onal purposes by
ers of Connect®
ANOVA
df
MS
F Significance F
Regression
1 1421.03539 1421.03539 283.68802 1.66697E-2
Residual
71 355.649537 5.00914841
Total
72 1776.68493
Coefficients indard Erro
t Stat
P-value Lower 95%| Upper 95% ower 95.0%Upper 95.0%
Intercept
40.0831549 1.15258813 34.7766509 2.48619E-4 37.7849595 42.3813504 37.7849595 42.3813504
Weight
-0.005167 0.00030678-16.843041 1.66697E-2-0.0057787|-0.0045553 -0.0057787 -0.0045553
Expert Solution
This question has been solved!
Explore an expertly crafted, step-by-step solution for a thorough understanding of key concepts.

This is a popular solution!

Trending now
This is a popular solution!

Step by step
Solved in 2 steps

Knowledge Booster


Learn more about
Need a deep-dive on the concept behind this application? Look no further. Learn more about this topic, statistics and related others by exploring similar questions and additional content below.Recommended textbooks for you
Linear Algebra: A Modern Introduction
Algebra
ISBN:
9781285463247
Author:
David Poole
Publisher:
Cengage Learning
Linear Algebra: A Modern Introduction
Algebra
ISBN:
9781285463247
Author:
David Poole
Publisher:
Cengage Learning