Using simultaneons equations arld oe the polnio below find the constant values of a,b, h and u,in the function: Y= ab"-h+le (exponenhal) Y =ab*"+k 00.0S5 10 0.048 20 0.042 30 0.037 40 0.033 50 0.029 60 0.026 70 0.D24 > exponential functlon must model da 80 0.022
Using simultaneons equations arld oe the polnio below find the constant values of a,b, h and u,in the function: Y= ab"-h+le (exponenhal) Y =ab*"+k 00.0S5 10 0.048 20 0.042 30 0.037 40 0.033 50 0.029 60 0.026 70 0.D24 > exponential functlon must model da 80 0.022

Functions and Change: A Modeling Approach to College Algebra (MindTap Course List)
6th Edition
ISBN:9781337111348
Author:Bruce Crauder, Benny Evans, Alan Noell
Publisher:Bruce Crauder, Benny Evans, Alan Noell
Chapter4: Exponential Functions
Section4.1: Exponential Growth And Decay
Problem 21SBE

Related questions
Question
using simultaneous equations how can i solve for the values of a, b, h and k to form the exponential function which models this data set?
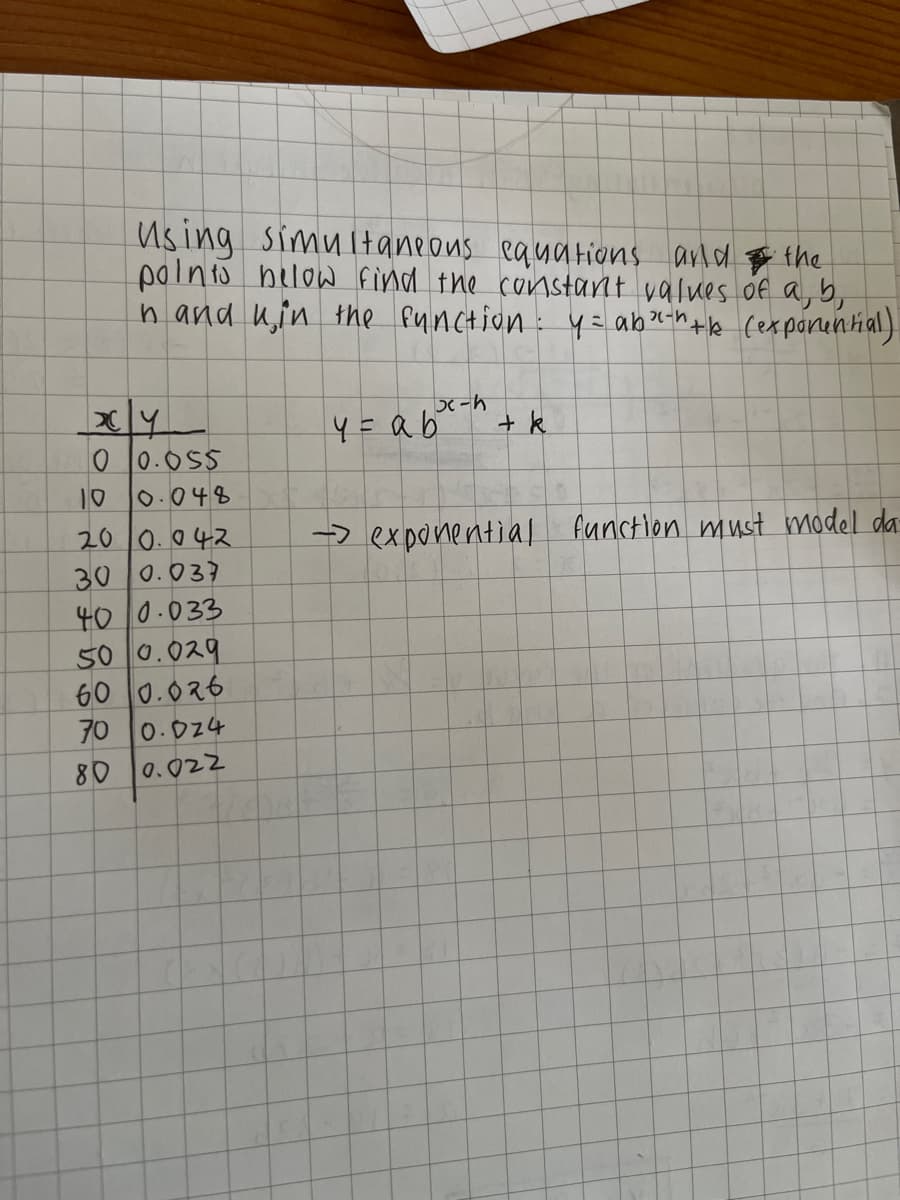
Transcribed Image Text:Using Simultaneons eauations arld o the
polnts below find the constant values of a,b,
h and u,in the function: y=abaihte (exponential)
4 =ab"
+ k
00.0S5
10
0.048
20 0.042
30 0.037
40 0.033
50 0.029
60 0.026
70 0.024
>exponential
function must model da
80
0.022
Expert Solution
This question has been solved!
Explore an expertly crafted, step-by-step solution for a thorough understanding of key concepts.

Step by step
Solved in 2 steps with 1 images

Recommended textbooks for you
Functions and Change: A Modeling Approach to Coll…
Algebra
ISBN:
9781337111348
Author:
Bruce Crauder, Benny Evans, Alan Noell
Publisher:
Cengage Learning


Trigonometry (MindTap Course List)
Trigonometry
ISBN:
9781337278461
Author:
Ron Larson
Publisher:
Cengage Learning
Functions and Change: A Modeling Approach to Coll…
Algebra
ISBN:
9781337111348
Author:
Bruce Crauder, Benny Evans, Alan Noell
Publisher:
Cengage Learning
Trigonometry (MindTap Course List)
Trigonometry
ISBN:
9781337278461
Author:
Ron Larson
Publisher:
Cengage Learning

Algebra & Trigonometry with Analytic Geometry
Algebra
ISBN:
9781133382119
Author:
Swokowski
Publisher:
Cengage

Algebra and Trigonometry (MindTap Course List)
Algebra
ISBN:
9781305071742
Author:
James Stewart, Lothar Redlin, Saleem Watson
Publisher:
Cengage Learning