using the data from the images, compare and analyze the trends shown on the graphs and relate them to the question: does chronic cigarette smoking affect the birth weight and gestational period of a newborn baby? Also please mention something regarding parents who don't smoke and their baby's results.
using the data from the images, compare and analyze the trends shown on the graphs and relate them to the question: does chronic cigarette smoking affect the birth weight and gestational period of a newborn baby? Also please mention something regarding parents who don't smoke and their baby's results.

Glencoe Algebra 1, Student Edition, 9780079039897, 0079039898, 2018
18th Edition
ISBN:9780079039897
Author:Carter
Publisher:Carter
Chapter10: Statistics
Section10.2: Representing Data
Problem 10PPS

Related questions
Question
using the data from the images, compare and analyze the trends shown on the graphs and relate them to the question: does chronic cigarette smoking affect the birth weight and gestational period of a newborn baby? Also please mention something regarding parents who don't smoke and their baby's results.
| Birth weight | Gestational period | Birthweight | Gestational period | |
| 2.65 | 33 | 1.92 | 33 | |
| 2.9 | 39 | 2.05 | 35 | |
| 2.92 | 34 | 2.37 | 37 | |
| 3.03 | 39 | 2.51 | 39 | |
| 3.11 | 37 | 2.66 | 35 | |
| 3.15 | 40 | 2.74 | 39 | |
| 3.2 | 41 | 2.75 | 40 | |
| 3.23 | 38 | 2.78 | 37 | |
| 3.27 | 40 | 3 | 38 | |
| 3.35 | 41 | 3.14 | 41 | |
| 3.42 | 38 | 3.18 | 38 | |
| 3.63 | 38 | 3.19 | 41 | |
| 3.65 | 42 | 3.32 | 40 | |
| 3.77 | 40 | 3.32 | 39 | |
| 3.93 | 38 | 3.41 | 39 | |
| 3.94 | 42 | 3.53 | 40 | |
| 4.07 | 44 | 3.55 | 41 | |
| 4.1 | 41 | 3.59 | 40 | |
| 4.32 | 40 | 3.64 | 40 | |
| 4.55 | 44 | 3.86 | 39 | |
| (non smoking) | 3.87 | 45 | ||
| 4.57 | 41 |
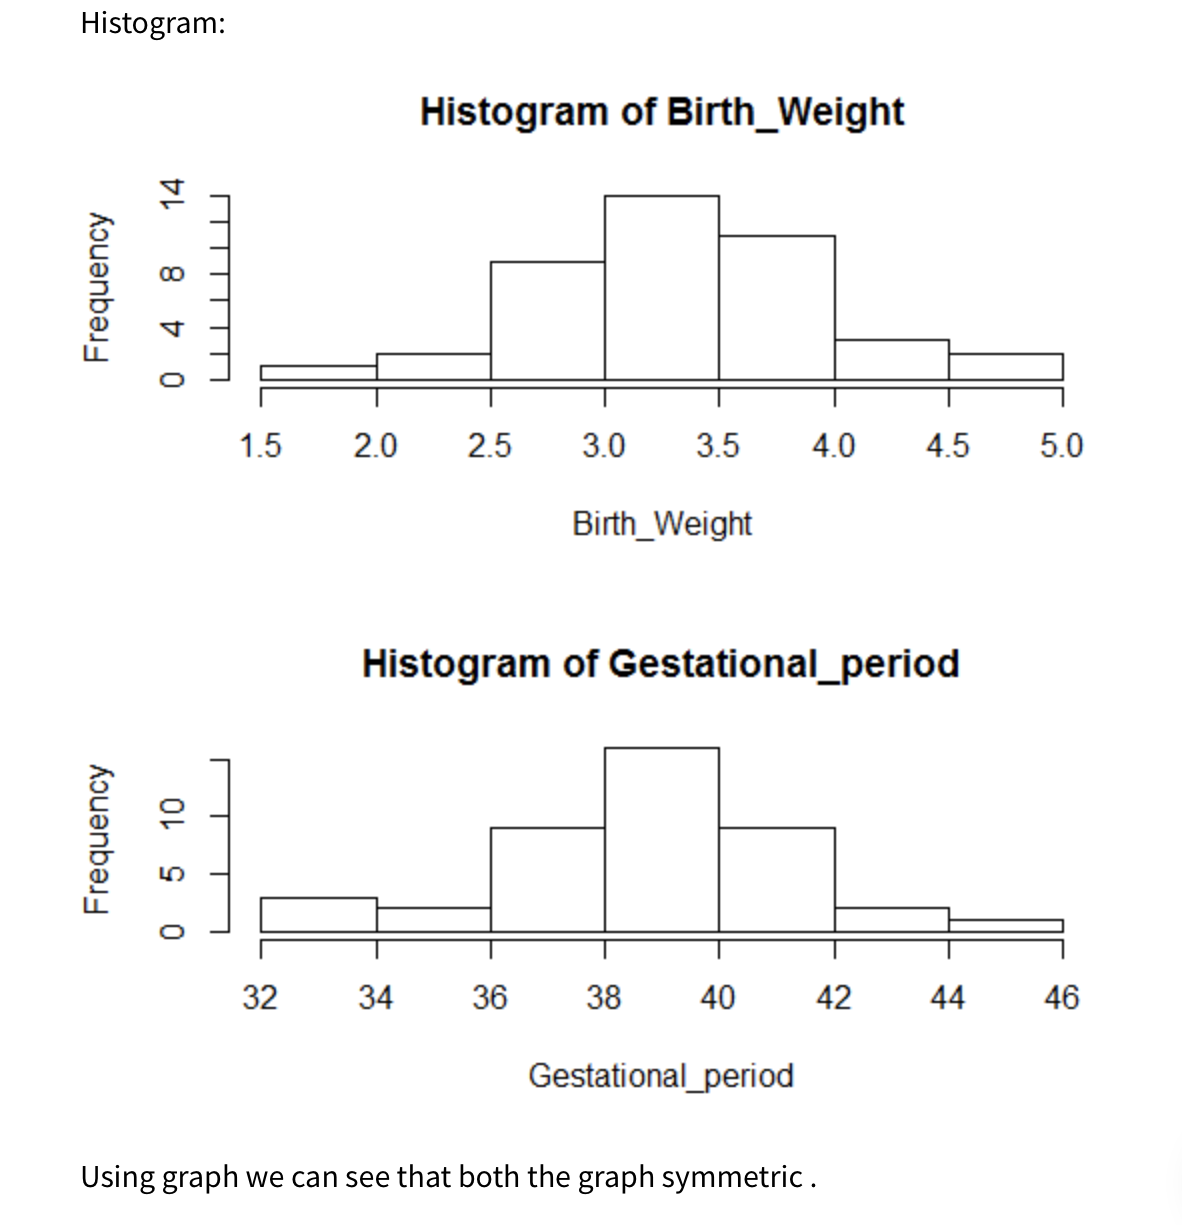
Transcribed Image Text:Histogram:
Histogram of Birth_Weight
1.5
2.0
2.5
3.0
3.5
4.0
4.5
5.0
Birth_Weight
Histogram of Gestational_period
32
34
36
38
40
42
44
46
Gestational_period
Using graph we can see that both the graph symmetric.
Frequency
05 10
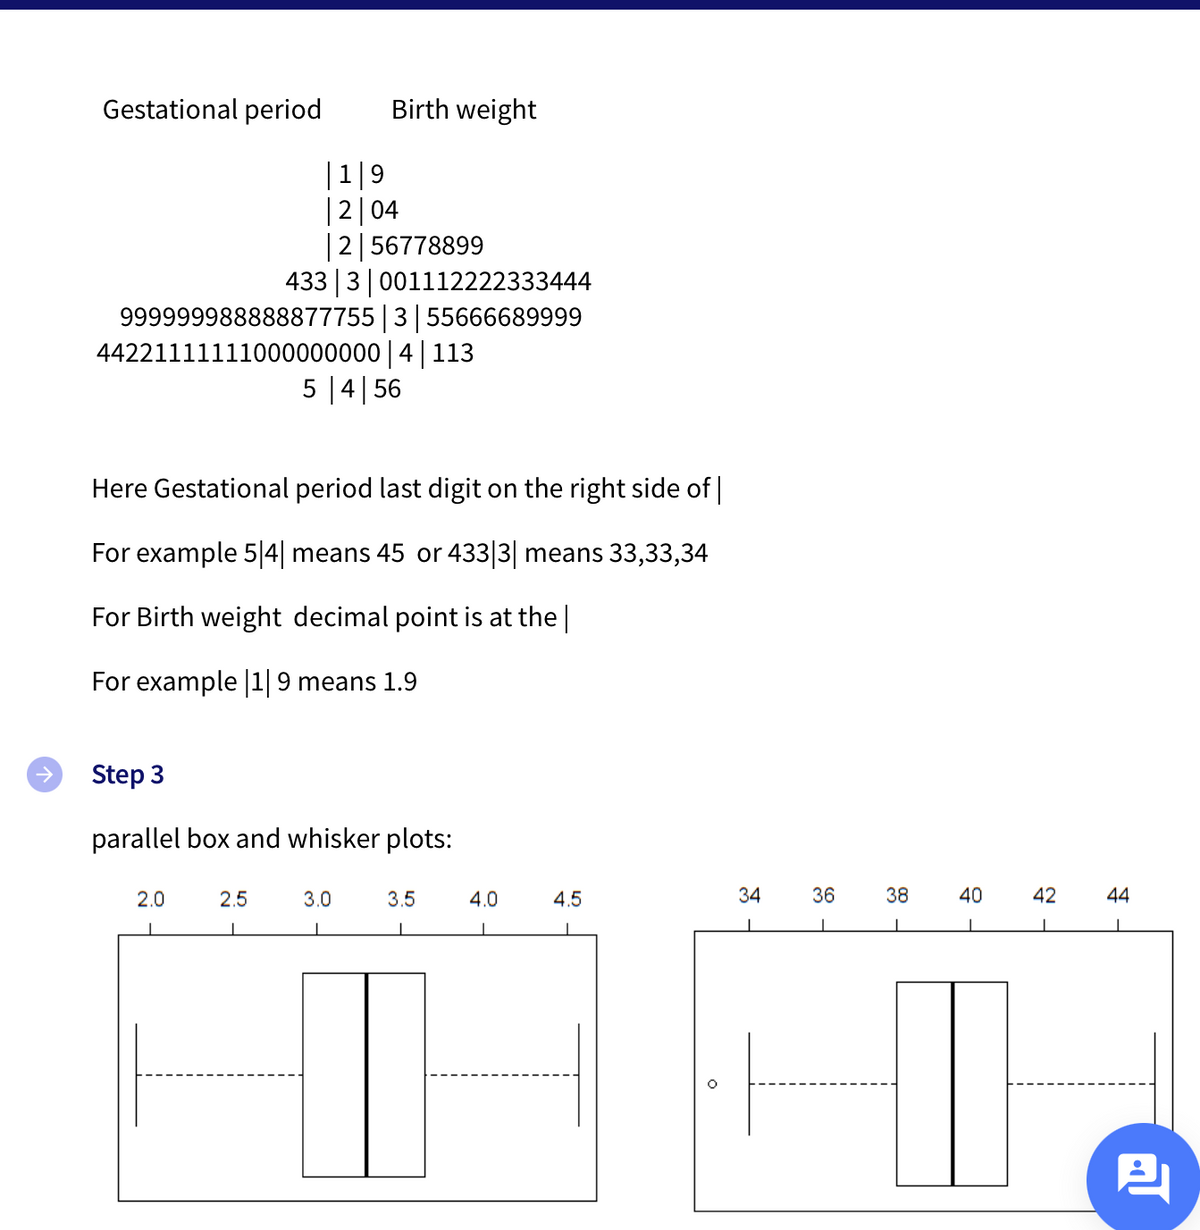
Transcribed Image Text:Gestational period
Birth weight
|1|9
| 2|04
2 56778899
433 |3| 001112222333444
999999988888877755|3|55666689999
44221111111000000000 4 113
5 |4|56
Here Gestational period last digit on the right side of |
For example 5|4| means 45 or 433|3| means 33,33,34
For Birth weight decimal point is at the|
For example 19 means 1.9
Step 3
parallel box and whisker plots:
2.0
2.5
3.0
3.5
4.0
4.5
34
36
38
40
42
44
Expert Solution
This question has been solved!
Explore an expertly crafted, step-by-step solution for a thorough understanding of key concepts.

Step by step
Solved in 2 steps

Recommended textbooks for you
Glencoe Algebra 1, Student Edition, 9780079039897…
Algebra
ISBN:
9780079039897
Author:
Carter
Publisher:
McGraw Hill
Glencoe Algebra 1, Student Edition, 9780079039897…
Algebra
ISBN:
9780079039897
Author:
Carter
Publisher:
McGraw Hill