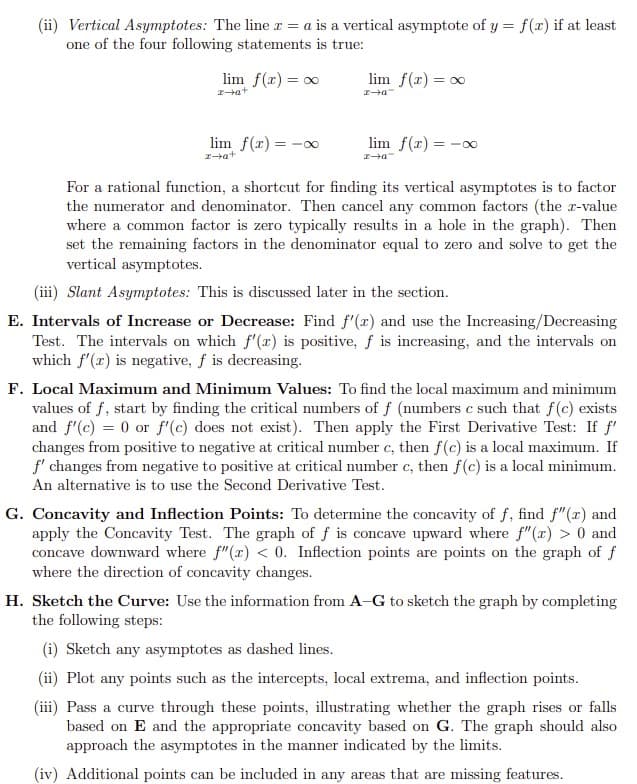
using the pictures provided solve For f(x) = 3x −9 3√x, find the domain, x-intercept(s), y-intercept, symmetry, vertical asymptotes, horizontal or slant asymptotes, intervals of increase or decrease, local maximum and minimum values, intervals of concavity, and inflection points. If any of the above characteristics are not present in the function, state NONE. Then, using these characteristics, sketch the curve. must show all steps.


Minimization
In mathematics, traditional optimization problems are typically expressed in terms of minimization. When we talk about minimizing or maximizing a function, we refer to the maximum and minimum possible values of that function. This can be expressed in terms of global or local range. The definition of minimization in the thesaurus is the process of reducing something to a small amount, value, or position. Minimization (noun) is an instance of belittling or disparagement.
Maxima and Minima
The extreme points of a function are the maximum and the minimum points of the function. A maximum is attained when the function takes the maximum value and a minimum is attained when the function takes the minimum value.
Derivatives
A derivative means a change. Geometrically it can be represented as a line with some steepness. Imagine climbing a mountain which is very steep and 500 meters high. Is it easier to climb? Definitely not! Suppose walking on the road for 500 meters. Which one would be easier? Walking on the road would be much easier than climbing a mountain.
Concavity
In calculus, concavity is a descriptor of mathematics that tells about the shape of the graph. It is the parameter that helps to estimate the maximum and minimum value of any of the functions and the concave nature using the graphical method. We use the first derivative test and second derivative test to understand the concave behavior of the function.
using the pictures provided solve For f(x) = 3x −9 3√x, find the domain, x-intercept(s), y-intercept, symmetry, vertical asymptotes, horizontal or slant asymptotes, intervals of increase or decrease,
![A. Domain: Find the domain D of f, which is the set of numbers for which f(x) is
defined.
B. Intercepts: Find the r- and y-intercepts of the graph of f, if they exist. The y-
intercept is (0, f(0)) and is where the graph intersects the y-axis. The r-intercepts are
the solutions to f (x) = 0 and are of the form (c, 0) where f(c) = 0. The r-intercepts
may be omitted if f(x) = 0 is difficult to solve.
C. Symmetry:
(i) If f(-x) = f(x) for all a in D, then f is an even function and its curve is
symmetric about the y-axis. For the graph of an even function, the graph of the
curve for r > 0 can be reflected over the y-axis to complete the graph. Common
examples of graphs with y-axis symmetry are y = x?, y = |r], and y = cos r.
(ii) If f(-x) = -f(x) for all z in D, then f is an odd function and its curve
is symmetric about the origin. For the graph of an odd function, the graph
of the curve for x > 0 can be rotated 180° about the origin to complete the
graph. Common examples of graphs with origin symmetry are y = , y = x and
y = sin r.
(iii) If f(r +p) = f (r) for all r in D, where p > 0 is a constant, then f is a periodic
function and the smallest such number p satisfying this condition is the period
of f. The graph of the function over an interval of p can then be translated to
complete the rest of the graph. Common examples of graphs that are periodic
are the trigonometric graphs y = sin r and y = cos r.
D. Asymptotes:
(i) Horizontal Asymptotes: If either lim f(r) = L or lim f(x) = L, then y = L
is a horizontal asymptote of y = f (x). If either of these limits approaches too,
there is not a horizontal asymptote but it is still useful information to know in
terms of sketching the graph of the function since it indicates how the sketch will
start and end. If f(a) is not defined and a is an endpoint of the domain of f, we
can find lim f(x) or lim f(x) instead.](/v2/_next/image?url=https%3A%2F%2Fcontent.bartleby.com%2Fqna-images%2Fquestion%2F685b0c8d-d878-45b2-96dc-6467738577d7%2F8bc26a0e-decb-40e3-9ad1-adce42e0bc39%2Fsuiezbf_processed.jpeg&w=3840&q=75)
Note:
There are many subparts in the given question so I will answer the first three of them and
other questions send separately.
Given:
We have to find the domain, the x-intercept(s), the y-intercept of the f(x).
(a) Domain of f(x):
We have,
The f(x) is well-defined for the whole real line. Hence, the domain for f(x) is:
(b) The x-intercepts:
The x-intercepts are the solution for f(x)=0.
Hence, the x-intercepts are:

Step by step
Solved in 3 steps with 1 images


