Using the same skill set, create the speed or velocity vs time graph for the given position vs time graphs. 1. Bike Ride Position vs. Time Speed vs. Time 40 40 30 30 20 을 201 10 10 2 4. 5 6 3 Hours 4 5 Hours 2. A walk in the park Position vs. Time Velocity vs. Time 800 600 400 200 10 50 60 20 30 Minutes 10 20 30 40 50 60 Minutes Miles Meters 2. 40 6, MPH Meters per Minute 08 -40 0 40 08-
Using the same skill set, create the speed or velocity vs time graph for the given position vs time graphs. 1. Bike Ride Position vs. Time Speed vs. Time 40 40 30 30 20 을 201 10 10 2 4. 5 6 3 Hours 4 5 Hours 2. A walk in the park Position vs. Time Velocity vs. Time 800 600 400 200 10 50 60 20 30 Minutes 10 20 30 40 50 60 Minutes Miles Meters 2. 40 6, MPH Meters per Minute 08 -40 0 40 08-

College Physics
11th Edition
ISBN:9781305952300
Author:Raymond A. Serway, Chris Vuille
Publisher:Raymond A. Serway, Chris Vuille
Chapter1: Units, Trigonometry. And Vectors
Section: Chapter Questions
Problem 68P: A map suggests that Atlanta is 730. miles in a direction 5.00 north of east from Dallas. The same...

Related questions
Question
Please solve this ASAP i am really stuck on this
Transcribed Image Text:Analyzing Graphs of Motion With Numbers
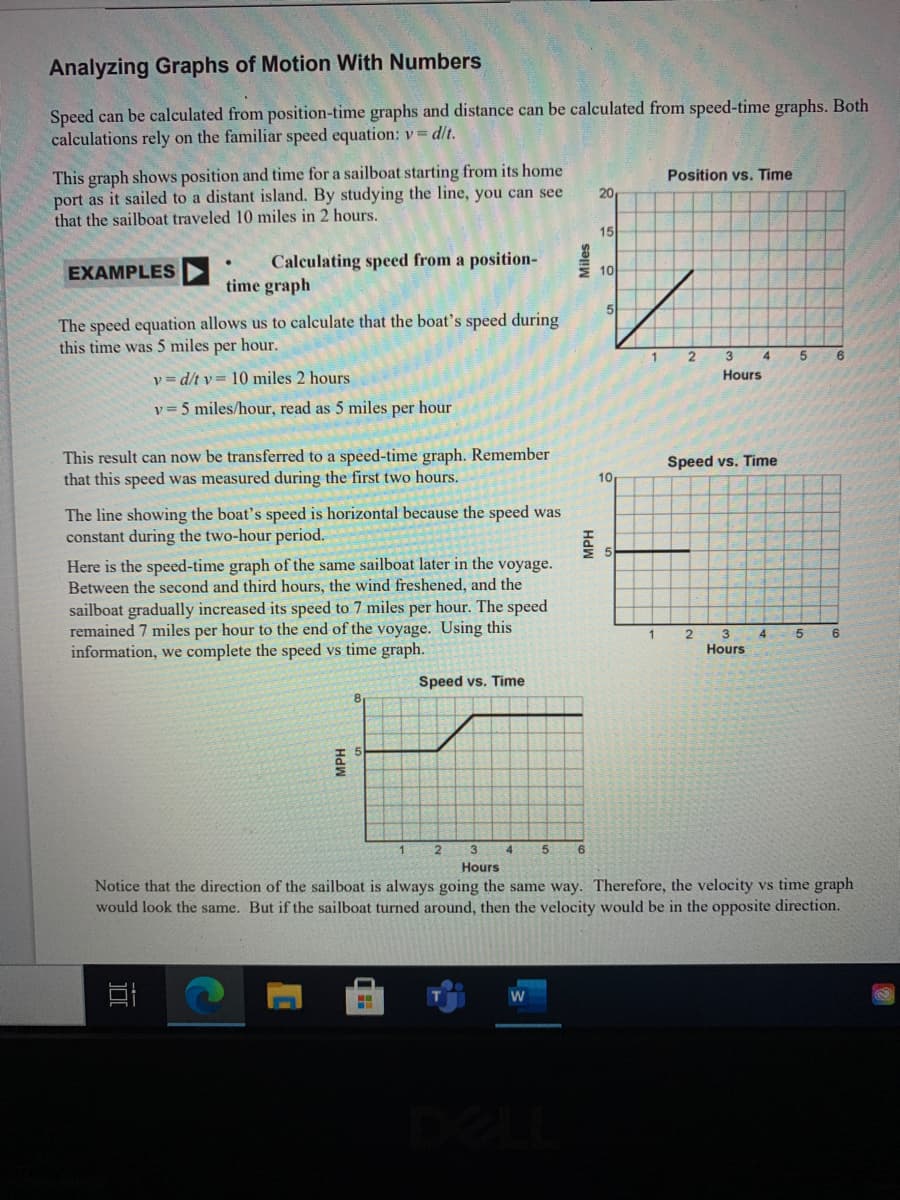
Speed can be calculated from position-time graphs and distance can be calculated from speed-time graphs. Both
calculations rely on the familiar speed equation: v= d/t.
This graph shows position and time for a sailboat starting from its home
port as it sailed to a distant island. By studying the line, you can see
that the sailboat traveled 10 miles in 2 hours.
Position vs. Time
20
15
Calculating speed from a position-
time graph
EXAMPLES
10
The speed equation allows us to calculate that the boat's speed during
this time was 5 miles per hour.
2
3
6
v= d/t v= 10 miles 2 hours
Hours
v = 5 miles/hour, read as 5 miles per hour
This result can now be transferred to a speed-time graph. Remember
that this speed was measured during the first two hours.
Speed
Time
10
The line showing the boat's speed is horizontal because the speed was
constant during the two-hour period.
Here is the speed-time graph of the same sailboat later in the voyage.
Between the second and third hours, the wind freshened, and the
sailboat gradually increased its speed to 7 miles per hour. The speed
remained 7 miles per hour to the end of the voyage. Using this
information, we complete the speed vs time graph.
4
5.
Hours
Speed vs. Time
3.
Hours
Notice that the direction of the sailboat is always going the same way. Therefore, the velocity vs time graph
would look the same. But if the sailboat turned around, then the velocity would be in the opposite direction.
HdW
MPH
Transcribed Image Text:A)
Read aloud Draw
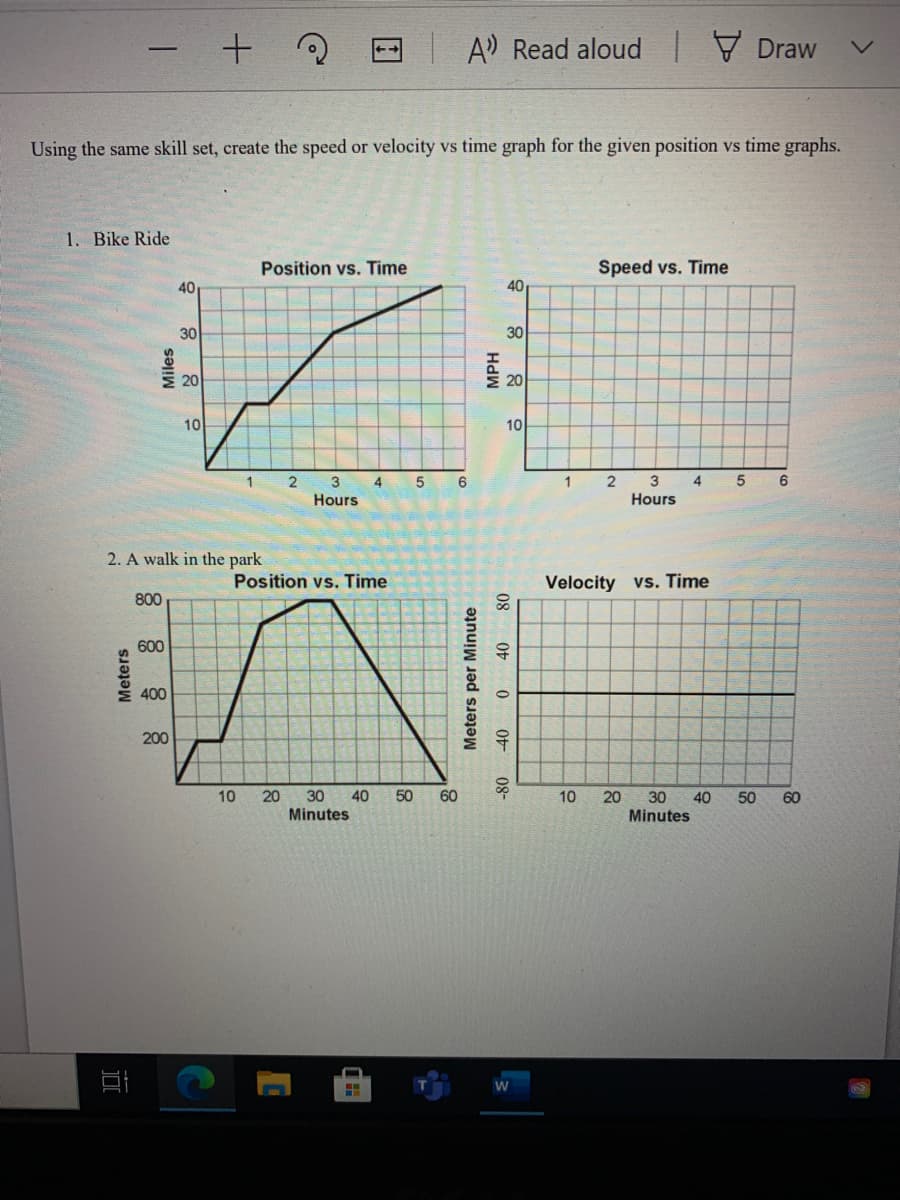
Using the same skill set, create the speed or velocity vs time graph for the given position vs time graphs.
亡
1. Bike Ride
Position vs. Time
Speed vs. Time
40
40
30
30
20
20
10
10
1
3
4
6.
2
3
Hours
4
5
6
1
Hours
2. A walk in the park
Velocity vs. Time
80
Position vs. Time
800
600
400
200
10
20
30
40
Minutes
50
60
10
20
30 40
50
60
Minutes
Expert Solution
This question has been solved!
Explore an expertly crafted, step-by-step solution for a thorough understanding of key concepts.

This is a popular solution!

Trending now
This is a popular solution!

Step by step
Solved in 2 steps with 24 images

Knowledge Booster


Learn more about
Need a deep-dive on the concept behind this application? Look no further. Learn more about this topic, physics and related others by exploring similar questions and additional content below.Recommended textbooks for you
College Physics
Physics
ISBN:
9781305952300
Author:
Raymond A. Serway, Chris Vuille
Publisher:
Cengage Learning

College Physics
Physics
ISBN:
9781938168000
Author:
Paul Peter Urone, Roger Hinrichs
Publisher:
OpenStax College

An Introduction to Physical Science
Physics
ISBN:
9781305079137
Author:
James Shipman, Jerry D. Wilson, Charles A. Higgins, Omar Torres
Publisher:
Cengage Learning
College Physics
Physics
ISBN:
9781305952300
Author:
Raymond A. Serway, Chris Vuille
Publisher:
Cengage Learning
College Physics
Physics
ISBN:
9781938168000
Author:
Paul Peter Urone, Roger Hinrichs
Publisher:
OpenStax College
An Introduction to Physical Science
Physics
ISBN:
9781305079137
Author:
James Shipman, Jerry D. Wilson, Charles A. Higgins, Omar Torres
Publisher:
Cengage Learning

University Physics Volume 1
Physics
ISBN:
9781938168277
Author:
William Moebs, Samuel J. Ling, Jeff Sanny
Publisher:
OpenStax - Rice University

Principles of Physics: A Calculus-Based Text
Physics
ISBN:
9781133104261
Author:
Raymond A. Serway, John W. Jewett
Publisher:
Cengage Learning