Using the table given, Which of the following is NOT necessarily true about the interpretation of the value of b in the simple linear regression equation y = a + bx for this problem? I. The monthly total costs will increase by $7.6437 for every one unit increase in the production volume. II. Since B > 0, there is a direct relationship between production volume and total costs. III. Because B > 1, there is a very strong positive linear relationship between production volume and total costs. a.) i and ii only b.) ii only c.) iii only d.) ii and iii only
Using the table given, Which of the following is NOT necessarily true about the interpretation of the value of b in the simple linear regression equation y = a + bx for this problem? I. The monthly total costs will increase by $7.6437 for every one unit increase in the production volume. II. Since B > 0, there is a direct relationship between production volume and total costs. III. Because B > 1, there is a very strong positive linear relationship between production volume and total costs. a.) i and ii only b.) ii only c.) iii only d.) ii and iii only

Algebra & Trigonometry with Analytic Geometry
13th Edition
ISBN:9781133382119
Author:Swokowski
Publisher:Swokowski
Chapter3: Functions And Graphs
Section3.3: Lines
Problem 76E

Related questions
Question
Using the table given, Which of the following is NOT necessarily true about the interpretation of the value of b in the simple linear regression equation y = a + bx for this problem?
I. The monthly total costs will increase by $7.6437 for every one unit increase in the production volume.
II. Since B > 0, there is a direct relationship between production volume and total costs.
III. Because B > 1, there is a very strong positive linear relationship between production volume and total costs.
a.) i and ii only
b.) ii only
c.) iii only
d.) ii and iii only
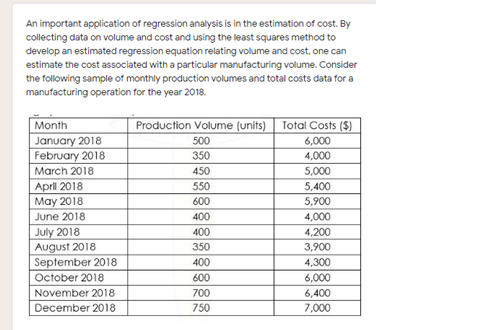
Transcribed Image Text:An important application of regression analysis is in the estimation of cost. By
collecting data on volume and cost and using the least squares method to
develop an estimated regression equation relating volume and cost, one can
estimate the cost associated with a particular manufacturing volume. Consider
the following sample of monthly production volumes and total costs data for a
manufacturing operation for the year 2018.
Month
Production Volume (units)
Total Costs ($)
January 2018
February 2018
500
6,000
350
4,000
March 2018
450
5,000
April 2018
May 2018
550
5,400
600
5,900
June 2018
400
4,000
July 2018
August 2018
September 2018
400
4,200
350
3,900
400
4,300
October 2018
600
6,000
November 2018
700
6,400
December 2018
750
7,000
Expert Solution
This question has been solved!
Explore an expertly crafted, step-by-step solution for a thorough understanding of key concepts.

Step by step
Solved in 3 steps

Recommended textbooks for you
Algebra & Trigonometry with Analytic Geometry
Algebra
ISBN:
9781133382119
Author:
Swokowski
Publisher:
Cengage

Glencoe Algebra 1, Student Edition, 9780079039897…
Algebra
ISBN:
9780079039897
Author:
Carter
Publisher:
McGraw Hill

Algebra & Trigonometry with Analytic Geometry
Algebra
ISBN:
9781133382119
Author:
Swokowski
Publisher:
Cengage
Glencoe Algebra 1, Student Edition, 9780079039897…
Algebra
ISBN:
9780079039897
Author:
Carter
Publisher:
McGraw Hill

Big Ideas Math A Bridge To Success Algebra 1: Stu…
Algebra
ISBN:
9781680331141
Author:
HOUGHTON MIFFLIN HARCOURT
Publisher:
Houghton Mifflin Harcourt