ust do last thre parts


Q: There are two candidates A & B running for an office. Suppose that 60% of the voters in the country…
A: We have a random variable X which follows Bernoulli distribution with the probability of Success…
Q: are female. Biologists suspect that male wolves are more likely than females to return to an area…
A: Given data Before 1918: Male 55% = 0.55 Female = 45% = 0.45 After 1918: Male 65% = 0.65 Female…
Q: Find the regression equation, letting the first variable be the predictor (x) variable. Using the…
A: The following information has been provided: Best Actress (x) Best Actor (y) 28 43 29 38 28…
Q: y time for patients after experiencing a serious injury. Suppose the mean recovery time is…
A: Given, sample size (n) = 45 sample mean (x̄) = 7.9 true population mean µ = 8.4 significance level α…
Q: Which of the following is the correct null hypothesis for a repeated-measures t test? a. MD = 0…
A: In this case, we need to identify suitable answer for the given statement.
Q: modified as follows: In a random sample of 55 panels, the average failure time is 2.07 years and the…
A: Given: n = 55 X = 2.07 s = 1.11 Confidence level = 91.7% Formula Used: Confidence interval = X ± tsn
Q: For a certain nationwide standardized test there are two commonly used preparation products on the…
A: Given that: Scores Study Focus 408, 400, 460, 587, 485, 559, 470, 439, 453, 531, 491, 481,…
Q: It is conjectured that the proportion of all people who went trick-or-treating who also had a…
A: Suppose p is the proportion of all people who went trick-or-treating who also had a pumpkin carved…
Q: Which of the following Pearson correlations shows the greatest strength or consistency of…
A: Here we have to identify Which of the following Pearson correlations shows the greatest strength or…
Q: 1 Part: 0/2 Part 1 of 2 Continue = 2 Part: 1/2 Let's go to the movies: A random sample of 42…
A: Here, mean is 110.2 standard deviation is 12.3. Sample is 42. We will use one sample z confidence…
Q: In the country of United States of Heightlandia, the height measurements of ten-year-old children…
A: Given Mean=56.7 Standard deviations=2.2
Q: In a study of exhaust emisions from school buses, the pollution intake by passen. gets was…
A: Given data: 1.15, 0.33, 0.40, 0.33, 1.35, 0.38, 0.25, 0.40, 0.35
Q: Test the claim that the proportion of people who own cats is larger than 70% at the 0.01…
A: given data claim :p>0.70α=0.01n=400p^ =0.73we have to complete the hypothesis testing for the…
Q: One epidemiologist raised the concern that people who enjoy physical activity might purposefully…
A: Given that an epidemiologist raised the concern that people who enjoy physical activity might…
Q: Using the IQ test. What is a typical score for the sample
A: The objective is to find the typical IQ score for the given sample.
Q: Under the normal curve, approximately what percent of scores fall between -2 to -3 standard…
A: The mean and standard deviation of the standard normal distribution are 0 and 1, respectively.
Q: A survey of 36 people was conducted to compare their self- reported height to their actual height.…
A: given data,n=36the diffrence between repoted height and actual height was calculated (D=reported…
Q: Of those mountain climbers who attempt Mt. Everest, 68.2% reach the summit. In a random sample of 25…
A: Given that: Sample size, n=25 Probability of success, p=0.682
Q: (c) Construct and interpret a 95% confidence interval for the mean age at which a baby first crawls.…
A: From given data we have : n=12
Q: Which hypothesis test needs to be employed here? z test one-sample t test Odependent t test…
A: It is given that the data of the relationship between age and golf performance.
Q: A particular fruit's weights are normally distributed, with a mean of 725 grams and a standard…
A:
Q: Smoking is a risk factor affecting patient’s cardiovascular system (and not only cardiovascular…
A: Hypothesis test are broadly classified into two types, they are parametric and non parametric test.…
Q: 9.43 Let Y₁, Y₂,..., Y, denote independent and identically distributed random variables from a power…
A: Given that Y1, Y2, . . ., Yn denote independent and identically distributed random variables from a…
Q: K (a) Identify the shape of the distribution, and (b) determine the five-number summary. Assume that…
A: Since we know that five number summary for the in any box-plot is denoted as in the following figure
Q: The following are data regarding number of minutes to accomplish a certain task: 121, 134, 145, 212,…
A: n = 9 x x2 121 14641 134 17956 145 21025 212 44944 289 83521 306 93636 367 134689…
Q: 10. A Gaussian RV X is N(0, o2-4). Find the conditional pdf: fxx>2(x); i.e., find the conditional…
A: X is a normal distribution with mean 0 and variance 4 X ~ N(0,σ2 =4) So, Z = X-04=X2 ~ N(0,1) CDF…
Q: Using the reading test scores. What is a typical score for the sample
A: Using the reading test scores. What is a typical score for the sample.
Q: 2. Do athletes in different sports vary in terms of intelligence? Below are reported College Board…
A: Given data: Basketball Football 87 92 84 85 79 86 86 84 82 72 83 73 84 80 88 82…
Q: that follow a Weibull distribution with m = 2 and a = 10 (with measurem of hours). e probability…
A:
Q: Suppose that we pick at random a value from a dataset whose probability distribution is normal…
A: Let X is bell shaped normally distributed random variable. That means X follows normal distribution…
Q: An investigator polls a representative sample of common cold sufferers, asking them to estimate the…
A: Given : An estimates approximate a normal curve with a mean of 91 hours and a standard deviation of…
Q: Many investors and financial analysts believe the Dow Jones Industrial Average (DJIA) gives a good…
A: Given information: Claim: The proportion of stocks that went up is significantly less than 0.3. A…
Q: 1. Match Column A with Column B by connecting a line between them (nainen Factorial Combination A…
A: Permutation is the arrangement of data in the orderly way. It arrange the n distinct object in the r…
Q: A group of students were asked if they carry a credit card. The responses are listed in the table.…
A: From the provided information, Class Credit Card Carrier Not a credit card carrier Total…
Q: 2. The manufacturer of a certain type of automobile claims that under typical urban driving…
A: Given that b...we have write the assumptions of Statistical test
Q: find (a) the 95% and (b) the 99% confidence intervals. (c) What do the answers to parts a and b…
A: The sample size n is 144, the sample mean is 300 and the population standard deviation is 100.
Q: Determine probabilities for z - values Assuming a standard normal distribution, find the…
A: given data standard normal distribution Z~N(0,1) find P(z > +1.0) = ? P(z > +.8) = ? P(z…
Q: Analyzing data, you found that the probability that a computer user clicks on the online ad of your…
A: The question is about identifying the distribution Given : Prob. of computer user clicks on the…
Q: The following are the number of employees of 20 supermarkets:…
A: Given the data of number of employees of supermarkets;…
Q: A simple random sample of 20 pages from a dictionary is obtained. The numbers of words defined on…
A: Given: n = 20 X = 58.9 s = 16.8 μ = 47.6 α = 0.05 Formula Used: Test-statistic-t = X-μsn
Q: Which of the following conditions must be met if a sample is to be regarded as a random sample? Each
A: It is given that the statement about to the random sample. Here, need to find out the correct choice…
Q: 000 estimate ck food for the d. Explain the theoretical meaning of the confidence coef- ficient,…
A: The sample proportion is p. And ,. p = X/ N
Q: Travel + Leisure magazine provides an annual list of the 500 best hotels in the world. The magazine…
A: Let X be a random variable denoting the hotel size that is, the number of rooms and Y denoting the…
Q: A researcher looks at a large set of data, and concludes the population has a standard deviation of…
A: It is given that the initial standard deviation is really 20, and the sample size is 64.
Q: A researcher is interested in the relationship between age and golf performance. The researcher…
A: The question is about correlation Given : To find : Appropriate value of z, t or r
Q: An article reported that in a large study carried out in the state of New York, approximately 60% of…
A: Using the approximately Normal distribution of Binomial distribution
Q: Ground beef is packaged in small trays, intended to hold 1 pound of meat. A random sample of 30…
A: Given information Hypothesized mean µ = 1 pound Sample size (n) = 30 Mean x̅ = 1.02 pounds Standard…
Q: Independent random samples were selected from two quantitative populations, with sample sizes,…
A: From the given information we conduct the hypothesis test.
Q: I need help with part 2 please. Thank you Bob Downe is auditing Red Cedar Office Furniture (RCOF),…
A: SOLUTION :- Given that , The Book value of population tested is (BV) = $6719028.95 The Tolearble…
Q: The average birth weight of a newborn baby in the USA is reported to be 7.5 lbs. A random sample of…
A: From the provided information, The average birth weight of a newborn baby in the USA is reported to…
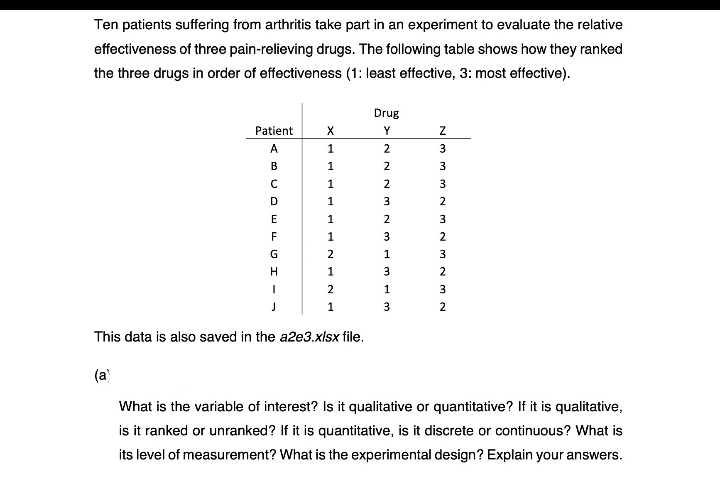
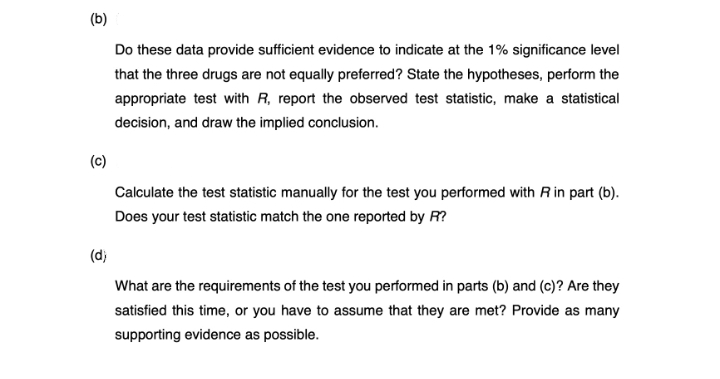
Just do last thre parts

Step by step
Solved in 3 steps with 2 images

- An article in the journal Applied Nutritional Investigation reported the results of a comparison of two different weight-loss programs (Liao, 2007). In the study, obese participants were randomly assigned to one of two groups and the percent of body fat loss was recorded. The soy group, a low-calorie group that ate only soy-based proteins (M= 2.30, s=0.55) , while the traditional group, a low-calorie group that received 2/3 of their protein from animal products and 1/3 from plant products (M= 1.22, s=0.50). If sM1–M2 = 0.3, s2pooled = 0.275, n1 = 6, n2 = 6 is there a difference between the two diets. Use alpha of .05 anda two-tailed test to complete the 4 steps of hypothesis testing.A student researcher was surprised to learn that the 2017 NCAA Student-Athlete Substance Use Survey supported that college athletes make healthier decisions in many areas than their peers in the general student body. He collected data of his own, focusing exclusively on male student-athletes to see if such habits vary based on one’s sport. He asked 93 male student-athletes whether they had engaged in binge-drinking in the last month (> 5 drinks in a single sitting). A student researcher was surprised to learn that the 2017 NCAA Student-Athlete Substance Use Survey supported that college athletes make healthier decisions in many areas than their peers in the general student body. He collected data of his own, focusing exclusively on male student-athletes to see if such habits vary based on one’s sport. He asked 93 male student-athletes whether they had engaged in binge-drinking in the last month (> 5 drinks in a single sitting). Data are provided in the table below.…A group of students in Methods of Social Research wanted to study the relationship between GPA and participation in athletics among ENC traditional undergraduates. Other researchers have found that students involved in Division III athletics often have higher GPAs than the rest of the student body, so the group of students in Methods wanted to know whether this was true for ENC students. They were able to gather data on 160 ENC students (80 athletes and 80 non-athletes) and found that, among this group, the 80 athletes had slightly higher GPAs on average than the 80 students who were not athletes. In this study, who makes up the sample? Who makes up the population? Suppose they found in the sample data that the overall GPA for ENC athletes was 3.35 and for the ENC non-athletes was 3.21. Are these statistics or parameters?
- The Chamber of Commerce in a Canadian city has conducted an evaluation of 300 restaurants in its metropolitan area. Each restaurant received a rating on a 3-point scale on typical meal price (1 least expensive to 3 most expensive) and quality (1 lowest quality to 3 greatest quality). A crosstabulation of the rating data is shown below. Forty-two of the restaurants received a rating of 1 on quality and 1 on meal price, 39 of the restaurants received a rating of 1 on quality and 2 on meal price, and so on. Forty-eight of the restaurants received the highest rating of 3 on both quality and meal price. Quality (x) Meal Price (y) Total 1 2 3 1 42 39 3 84 2 33 63 54 150 3 3 15 48 66 Total 78 117 105 300 (a) Develop a bivariate probability distribution for quality and meal price of a randomly selected restaurant in this Canadian city. Let x = quality rating and y = meal price. Quality (x) Meal Price (y) Total 1 2 3 1 2 3 Total…Using a theoretical framework from engineering sciences, the researcher believes that the physical set up of hospital rooms impacts rates of hand washing. After prolonged engagement, she observed the healthcare providers working on a medical/surgical floor of a hospital. As the result of her data analysis she purposefully selected 6 physicians, 10 nurses and 12 nursing aids to conducted in-depth interviews with. Subsequent to the analysis of that data she then purposefully selected 5 medical residents, 10 more nurses, the radiographers assigned to the portable imaging machine, and 15 patient transporters to conduct interviews with. She uses the data she collected and analyzed to develop a survey that she sent to 100 randomly selected hospitals across the northeast. What research design was used in this study? a. Mixed Methods b. Exploratory c. Convergent d. ExplanatoryResearchers investigated whether elementary school students from families in need would choose healthier lunch options if offered. A random sample of students receiving free-and-reduced lunch at five different Connecticut elementary schools were offered a choice between 2 lunch options. One was a typical school lunch prepared off and warmed on campus, while the other was a healthier school lunch made on campus from a variety of fruits, vegetables, and lean protein. For each child, researchers kept track of whether or not the child selected the healthier option. The research question was whether of not the healthier option would be selected less than the typical school lunch. More specifically, we will investigate whether the sample data provide strong evidence that the heather lunch is picked less than 50% of the time? The researchers found in their sample of 294 students that 134 picked the healthier option. The value of the sample proportion who selected the candy is therefore…
- A researcher is studying two types of medication that both treat hives. 23 out of the random sample of 334 adults given medication A still had hives 30 minutes after taking the medication. 18 out of another random sample of 346 adults given medication B still had hives 30 minutes after taking the medication. Test to see if the proportion of people who still had hives after medicine A is different than the proportion of people who still had hives after medicine B. Use a 0.01 level of significance.The Chamber of Commerce in a Canadian city has conducted an evaluation of 300 restaurants in its metropolitan area. Each restaurant received a rating on a 3-point scale on typical meal price (1least expensive to 3 most expensive) and quality (1 lowest quality to 3 greatest quality). A crosstabulation of the rating data isshown below. Forty-two of the restaurants received a rating of 1on quality and 1on meal price,39 of the restaurants received a rating of 1on quality and 2 on meal price, and so on.Forty-eight of the restaurants received the highest rating of 3 on both quality and meal price. a. Develop a bivariate probability distribution for quality and meal price of a randomly selected restaurant in this Canadian city.Let x = quality rating and y = meal price b. Compute the expected value and variance for quality rating,x. c. Compute the expected value and variance for meal price, d. The Var(x +y) = 6691. Compute the covariance of x and y.What can you say about the relationship…A large nationwide survey showed that 65% of high school students like Coca-Cola better than Pepsi. Dr.Johnson conducted a small survey of randomly selected high school students in Michigan and found that 180 ofthe 300 surveyed students liked Coca-Cola better than Pepsi. Test if the proportion of students that preferCoca-Cola over Pepsi is significantly different than the percentage indicated by the nationwide survey with asignificance level of 5%.