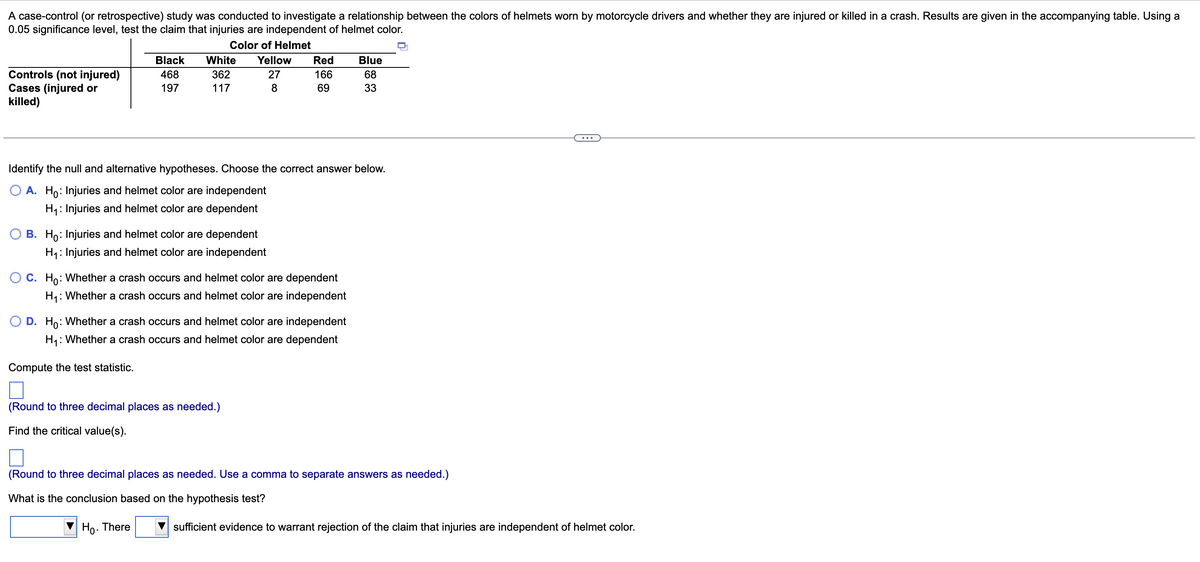
vas conducted to investigate a relationship at injuries are independent of helmet color. Color of Helmet Yellow 27 White Red Blue 362 166 69 68 117 8 33


Q: (a) Suppose that 20 % persons in a large group of people are obese. If persons are checked one by…
A: If we have a sequence of trials each having two outcomes, say Success and Failure, trials being…
Q: XIY 2 4 5 1 1/12 1/24 1/24 2 1/6 1/12 1/8 3 1/4 1/8 1/12 a. Find P(XS2,YS4) b. Find the marginal…
A:
Q: 4.20 A continuous random variable X has the density function e-ª, x > 0, f(2) = {." 0, elsewhere.…
A:
Q: is 6/9 and 12/18 equivalent
A: We have given that, Is 6/9 and 12/18 equivalent?
Q: The actual volume of seven oil cans labeled as 12 liters are as follows: 11.77, 11.90, 11.64, 11.84,…
A: We have given that, The data set are :- 11.77, 11.90, 11.64, 11.84, 12.13, 11.99, 11.77 Then, We…
Q: glass Böttles from a vendor. The bottles are required to have an internal pressure of at least 150…
A:
Q: If the probability of a person winning on a scratch-off lottery ticket is 0.375, the odds of winning…
A:
Q: A geography test was given to a simple random sample of 500 high-school students in a certain large…
A: Given information: A geography test was given to a simple random sample of 500 high-school students…
Q: A five-member committee is being formed from a group of 9 sophomores and 12 seniors. How many…
A: Hello! As you have posted more than 3 sub parts, we are answering the first 3 sub-parts. In case…
Q: 1. In the KAU prize giving day, 9 women and 6 men are selected from the CS denartment
A: Given: Number of women selected =9 number of men selected =6
Q: A paper bag contains a mixture of three types of treats: 12 granola bars, 10 fruits bars, and 8…
A:
Q: Identify whether the given is a discrete or continuous variable.
A: here use basic of continuous and discrete variable
Q: Example 4-10: A joint discrete probability function f(r, y) is expressed below. Find P(z+yS1). KL 3.…
A:
Q: A survey of 1000 people asked whether they wear eyeglasses while driving. These people were also…
A:
Q: Question 4 [25] The amount of time devoted to preparing for a statistics examination by students is…
A:
Q: Q3) Eighty-four student (67 from moming and 17 from evening) in second stage of electronic branch…
A:
Q: candy company distributes boxes of chocolates with a mixture of creams, toffees, and cordials.…
A: Solution
Q: 16. A bag contains 4 chocolates, 7 jellybeans, and 9 gummy bears. A candy is picked from the bag.…
A: AS per guidelines i have calculated first main question plz repost for remaining with note i need…
Q: 6) A set of data has a normal distribution with a mean of 50 and a standard deviation of 10. Find…
A: Given that mean =50 ,s.d =10
Q: Suppose we toss a fair die. Let A denote the event that we obtain a most 2 spots atop the die and…
A: Given that, If a fair die is tossed, A is the event that we obtain at most 2 spots on the die and B…
Q: Substitute x = 1, n = 9, and p = 0.18 into the binomial pmf formula below and solve. (Round your…
A:
Q: A family's cat is pregnant with 4 kittens. If the probability each kitten will be gray like the…
A: here from given information p = probability of kitten is not gray = 1 - 0.49 = 0.51 n = 4
Q: elsewhere If Y = X be a function of X, find the density function of Y using method of distribution…
A:
Q: L Simplify each of the following expression. 7. (8!7!) 5!4! 12! 3!2! 10 8. 4!3! 45! .0. 43!5!
A: As per company guidelines I solved exactly three subparts of the question. GIVEN SIMPLIFY EXPRESSION…
Q: Let X1 be the number of Australian adults drinking red wine in a random sample of 37 people gathered…
A: It is given that X1 is the number of Australian adults drinking red wine in a random sample of 37…
Q: ind the probability that when you select one piece from the white pieces and then s second piece…
A:
Q: Determine whether the action results in independent or dependent event. Pick one marble out of a…
A:
Q: The following information was recorded in a toy store: Year 2016 Year 2017 Year 2018 Price Quantity…
A: Note: As per the guidelines we are supposed to solve only first three subparts. Please repost the…
Q: Q6 The actual volume of seven oil cans labeled as 12 liters are as follows: 11.77, 11.90, 11.64,…
A: We have given that, The data set are : 11.77, 11.90, 11.64, 11.84, 12.13, 11.99, 11.77 Then, We…
Q: 7. (8!7!) 5!4! 12! 3!2! 10 8. 4!3! 45! 0. 43!5!
A: we know; n! = n*(n-1)*(n-2)*...*3*2*1 i.e. n!=n*(n-1)!
Q: stigatión öf än öutbrea veakness among resid entified as flour uninte
A: Age BLL Log BLL 1 3 69 1.838849 2 4 45 1.653213 3 6 49 1.690196 4 7 84 1.924279 5 9 48…
Q: I duration. What is the probability that the duration of a particular rainfall event at this…
A: Given Mean=2.675
Q: A set of data items is normally distributed with a mean of 50 and a standard deviation of 8. Convert…
A: We have given that Mean, μ = 50 Standard deviation, σ = 8 Z-Score, z = ( X - μ )/σ
Q: I. Determine if the events below are mutually exclusive or not mutually exclusive.
A: here use basic of mutually exclusive events
Q: 3) A normal distribution has a mean of 75 and a standard deviation of 15. Determine the z-score for…
A: The random variable X follows normal distribution. We have to find the z-score. This is one sample…
Q: A system for a random amount of time X (in units of months) is given by a density (txe2 : x>0, :…
A: The moment generating function is defined as MX(t)=EetX
Q: (a) Suppose that 20 % persons in a large group of people are obese. If persons are checked one by…
A:
Q: 1. Suppose the following game is repeated infinitely. The players have a common discount factor & E…
A:
Q: 21. A group of 10 women and 6 men must select a four-person committee. How many committees are…
A: (a) Determine the number of committees that the two men and two women can be selected. The…
Q: 2. The number of meteors found by a radar system in any 30-second interval under specified…
A: Given: The number of meteors found by a radar system in any 30-second interval under specified…
Q: 21. A group of 10 women and 6 men must select a four-person committee. How many committees are…
A: As per the Bartleby guildlines we have to solve first three subparts and rest can be reposted...…
Q: The Wycoffs are planning their next family night. They always have dinner out somewhere and then do…
A: The answer is attached below,
Q: The joint PDF of two continuous random variables X and y is given: S(x, v) = e,x> 0, y> 0. Let U =…
A:
Q: Use the binomial theorem to show that for all integers n 2 1, 3" = (6) + 2 (4) + 2° (") -
A:
Q: Suppose the force acting on a column that helps to support a building is a normally distributed…
A: Given Data : Population Mean,μ = 19 Population Standard Deviation,σ = 1.5
Q: There are 5000 observations in a data set. 10% of the data are “1”s, while the rest are “0”s. If we…
A:
Q: 16. A bag contains 4 chocolates, 7 jellybeans, and 9 gummy bears. A candy is picked from the bag.…
A: The problem 15 is not visible, so it is assumed that the request is for problem 16. Let there are…
Q: (a) Suppose that 20 % persons in a large group of people are obese. If persons are checked one by…
A:
Q: 0.7. Determine the probability that a component that is free of component faults is then assembled…
A: HERE define events product has no component fault = C component assembled correctly = A
Q: AGE Always Sometimes Never 18-29 53 43 4 30-49 47 45 8 50-64 34 41 24 65+ 23 36 34
A:
8.

Step by step
Solved in 3 steps

- A case-control (or retrospective) study was conducted to investigate a relationship between the colors of helmets worn by motorcycle drivers and whether they are injured or killed in a crash. Results are given in the accompanying table. Using a 0.05 significance level, test the claim that injuries are independent of helmet color. Color of Helmet Black White Yellow Red Blue Controls (not injured) 479 346 32 164 88 Cases (injured or killed) 201 99 9 67 43A case-control (or retrospective) study was conducted to investigate a relationship between the colors of helmets worn by motorcycle drivers and whether they are injured or killed in a crash. Results are given in the accompanying table. Using a 0.05 significance level, test the claim that injuries are independent of helmet color. Black; White; Yellow; Red; Blue Controls (not injured) 500; 355; 32; 173; 79 Cases (injured or killed) 220; 115; 9; 71; 38Independent random samples of 32 people living on the west side of a city and 30 people living on the east side of a city were taken to determine if the income levels of west side residents are significantly different from the income levels of east side residents. Given the testing statistics below, determine if the data provides sufficient evidence to conclude that the income levels of west side residents are significantly different from the income levels of east side residents, at the 2% significance level. H0:μw=μeHa:μw≠μe t0=2.364 t0.01=±2.099 Select the correct answer below: No; the test statistic is not between the critical values. No; the test statistic is between the critical values. Yes; the test statistic is not between the critical values. Yes; the test statistic is between the critical values.
- Does It Pay to Plead Guilty? The accompanying table summarizes randomly selected sample data for San Francisco defendants in burglary cases (based on data from “Does It Pay to Plead Guilty? Differential Sentencing and the Functioning of the Criminal Courts,” by Brereton and Casper, Law and Society Review, Vol. 16, No. 1). All of the subjects had prior prison sentences. Use a 0.05 significance level to test the claim that the sentence (sent to prison or not sent to prison) is independent of the plea. If you were an attorney defending a guilty defendant, would these results suggest that you should encourage a guilty plea?A standardized math test was administered to two groups of 5th graders, one group sampled from classes whose teachers had followed the existing curriculum and one group sampled from classes whose teachers had followed a new curriculum, and the scores were compared using a t-test with the following results: t-test: Two-Sample Assuming Equal Variances Old Curriculum New Curriculum Mean 75.31914894 65.65957447 Variance 118.613321 801.1424607 Obervations 47 47 Hypothesized Mean Difference 0 df 92 t Stat 2.183587807 P(T<=t) one-tail 0.015768226 t Critical one-tail 1.661585397 P(T<=t) two-tail 0.031536452 t Critical two-tail…Independent random samples of 31 people living on the west side of a city and 25 people living on the east side of a city were taken to determine if the income levels of west side residents are greater than the income levels of east side residents. Given the testing statistics below, determine if the data provides sufficient evidence to conclude that the income levels of west side residents are greater than the income levels of east side residents, at the 2% significance level. H0:μw≤μeHa:μw>μe t0=0.511 t0.02=2.104 Select the correct answer below: Yes; the test statistic is greater than the critical value. No; the test statistic is greater than the critical value. No; the test statistic is less than the critical value. Yes; the test statistic is less than the critical value.
- A case control study was conducted to investigate a relationship between the colors of helmets worn by motorcycle drivers and whether they are injured or killed in a crash. Results are given in the accompanying table. Using a .01 significance level, test the claim that injuries are independent of helmet color. Blackhelmet white helmet Yellow helmet Red helmet Blue helmet Not injured 472 362 35 161 69 Injured 195 105 9 69 33The Youth Risk Behavior Survey (a study of public high school students) showed that 45 of 675 girls and 103 of 621 boys had been in a physical fight on school property one or more times during the past 12 months Using 5% significance, perform an appropriate test of hypothesis that the proportion of girlsinvolved in a physical fight on school property is less than the proportion of boys involved in a physical fight on school property.Step 1: H0: ________________ Ha: ____________________ Significance level α =0.05Step 2: Check necessary data conditions and compute an appropriate test statistic:Step 3: Compute corresponding p-valueA standardized math test was administered to two groups of 5th graders, one group sampled from classes whose teachers had followed the existing curriculum and one group sampled from classes whose teachers had followed a new curriculum, and the scores were compared using a t-test with the following results: Old Curriculum New Curriculum Mean 68.76595745 75.4893617 Variance 22.226642 33.8640148 Obervations 47 47 Hypothesized Mean Difference 0 df 88 t Stat -6.154501628 P(T<=t) 0.00 t Critical one-tail 1.662354029 P(T<=t) two-tail 0.00 t Critical two-tail 1.987289865 You decide to use the conventional p=.05 as your…
- A standardized math test was administered to two groups of 5th graders, one group sampled from classes whose teachers had followed the existing curriculum and one group sampled from classes whose teachers had followed a new curriculum, and the scores were compared using a t-test with the following results: Old Curriculum New Curriculum Mean 75.31914894 65.65957447 Variance 118.613321 801.1424607 Observations 47 47 Pooled Variance 459.8778908 Hypothesized Mean Difference 0 df 92 t Stat 2.1835887807 P(T<=)one tail 0.015768226 t Critical one-tail 1.661585397 P(T<=t) two-tail 0.031536452 t Critical two-tail 1.986086317 You decide to use the conventional p=.05 as your cutoff for statistical significance. What do you conclude from this analysis? a.…A standardized math test was administered to two groups of 5th graders, one group sampled from classes whose teachers had followed the existing curriculum and one group sampled from classes whose teachers had followed a new curriculum, and the scores were compared using a t-test with the following results: Old Curriculum New Curriculum Mean 65.06382979 66.5106383 Variance 822.4523589 127.5161887 Obervations 47 47 Hypothesized Mean Difference 0 df 60 t Stat -0.321814324 P(T<=t) 0.37 t Critical one-tail 1.670648865 P(T<=t) two-tail 0.75 t Critical two-tail 2.000297822 You decide to use the conventional p=.05 as your…Are low-fat diets or low-carb diets more effective for weight loss? This question was addressed in the article “Comparison of the Atkins, Zone, Ornish, and LEARN Diets for Change in Weight and Related Risk Factors Among Overweight Premenopausal Women: The A TO Z Weight Loss Study: A Randomized Trial” (C. Gardner, A. Kiazand, et al., Journal of the American Medical Association, 2007:969–977). A sample of 77 subjects went on a low-carbohydrate diet for six months. At the end of that time the sample mean weight loss was 4.7 kg with a sample standard deviation of 7.2 kg. A second sample of 79 subjects went on a low-fat diet. Their sample mean weight loss was 2.6 kg with a standard deviation of 5.9 kg. a) Can you conclude that the mean weight loss is greater for those on the low-carbohydrate diet? b) Can you conclude that the mean weight loss on the low-carbohydrate diet is more than 1 kg greater than that of the low-fat diet?
