vertising campaign. The Director recorded the advertising the last eight months. The data is shown in the table below advertising cost. 60.86 61.53 68.8 6 Advertising cost, in thousands USD (x) Number of tickets sold, in 2.86 1.62 2.37 thousands (y) a) Create a box whisker diagram for ogoh doto. cot
vertising campaign. The Director recorded the advertising the last eight months. The data is shown in the table below advertising cost. 60.86 61.53 68.8 6 Advertising cost, in thousands USD (x) Number of tickets sold, in 2.86 1.62 2.37 thousands (y) a) Create a box whisker diagram for ogoh doto. cot

Glencoe Algebra 1, Student Edition, 9780079039897, 0079039898, 2018
18th Edition
ISBN:9780079039897
Author:Carter
Publisher:Carter
Chapter10: Statistics
Section10.6: Summarizing Categorical Data
Problem 10CYU

Related questions
Question
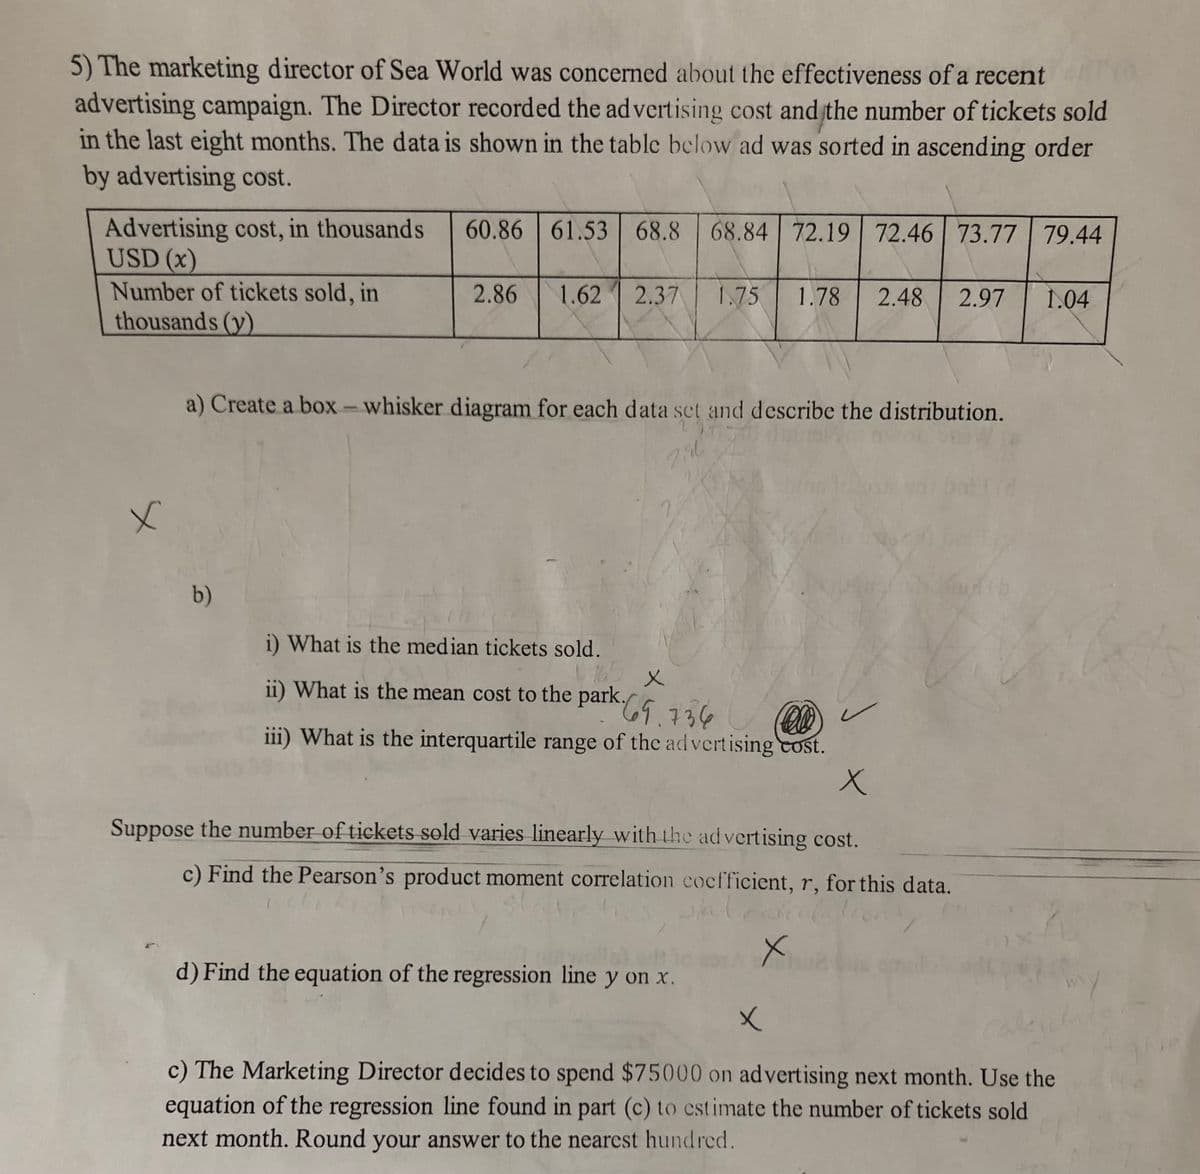
Transcribed Image Text:5) The marketing director of Sea World was concerned about the effectiveness of a recent
advertising campaign. The Director recorded the advertising cost and the number of tickets sold
in the last eight months. The data is shown in the table below ad was sorted in ascending order
by advertising cost.
60.86 61.53 68.8 68.84 72.19 72.46 73.77 79.44
Advertising cost, in thousands
USD (x)
Number of tickets sold, in
2.86 1.62 2.37 1.75 1.78 2.48 2.97 1.04
thousands (y)
a) Create a box - whisker diagram for each data set and describe the distribution.
2.dl
f
i) What is the median tickets sold.
765
x
ii) What is the mean cost to the park.69.736
iii) What is the interquartile range of the advertising cost.
X
Suppose the number of tickets sold varies linearly with the advertising cost.
c) Find the Pearson's product moment correlation coefficient, r, for this data.
stat catulations
d) Find the equation of the regression line y on x.
X
x
c) The Marketing Director decides to spend $75000 on advertising next month. Use the
equation of the regression line found in part (c) to estimate the number of tickets sold
next month. Round your answer to the nearest hundred.
b)
7
Expert Solution
This question has been solved!
Explore an expertly crafted, step-by-step solution for a thorough understanding of key concepts.

Step by step
Solved in 3 steps with 3 images

Recommended textbooks for you
Glencoe Algebra 1, Student Edition, 9780079039897…
Algebra
ISBN:
9780079039897
Author:
Carter
Publisher:
McGraw Hill
Glencoe Algebra 1, Student Edition, 9780079039897…
Algebra
ISBN:
9780079039897
Author:
Carter
Publisher:
McGraw Hill