vesigate difference in employee satisfaction at non-profit organizations and at for-profit companies. Data collected from 420 employees at non-profit organizations revealed that 378 of them were "highly satisfied." From the for-profit companies, 417 out of 493 employees reported the same level of satisfaction. Researchers want to test if the proportions of satisfied employees are the same at for-profit companies as at non-profit companies. Complete parts a through c below. The difference in the sample proportions, P, -P2. is (Round to three decimal places as needed.) b) What is the value of the z-statistic? Write the appropriate hypotheses. Let p, be the proportion of satisfied employees from non-profit organizations. Let p, be the proportion of satisfied employees from for-profit companies. Choose the correct answer below. OA. H P,-Pa=0 HA: P-P2>0 OC. H P,-P2>0 HA P-P2=0 O B. H P,- P2=0 Ha P-P2#0 OD. H P,-P2*0 Determine the test statistic. 2= (Round to two decimal places as needed.) c) What do you conclude at a= 0.05? Find the P-value. P= (Round to three decimal places as needed.) State the conclusion. V the null hypothesis. There V sufficient evidence to conclude that the proportions of satisfied employees in non-profit organizations and in for-profit companies are different.
vesigate difference in employee satisfaction at non-profit organizations and at for-profit companies. Data collected from 420 employees at non-profit organizations revealed that 378 of them were "highly satisfied." From the for-profit companies, 417 out of 493 employees reported the same level of satisfaction. Researchers want to test if the proportions of satisfied employees are the same at for-profit companies as at non-profit companies. Complete parts a through c below. The difference in the sample proportions, P, -P2. is (Round to three decimal places as needed.) b) What is the value of the z-statistic? Write the appropriate hypotheses. Let p, be the proportion of satisfied employees from non-profit organizations. Let p, be the proportion of satisfied employees from for-profit companies. Choose the correct answer below. OA. H P,-Pa=0 HA: P-P2>0 OC. H P,-P2>0 HA P-P2=0 O B. H P,- P2=0 Ha P-P2#0 OD. H P,-P2*0 Determine the test statistic. 2= (Round to two decimal places as needed.) c) What do you conclude at a= 0.05? Find the P-value. P= (Round to three decimal places as needed.) State the conclusion. V the null hypothesis. There V sufficient evidence to conclude that the proportions of satisfied employees in non-profit organizations and in for-profit companies are different.

Glencoe Algebra 1, Student Edition, 9780079039897, 0079039898, 2018
18th Edition
ISBN:9780079039897
Author:Carter
Publisher:Carter
Chapter10: Statistics
Section10.5: Comparing Sets Of Data
Problem 26PFA

Related questions

Topic Video
Question
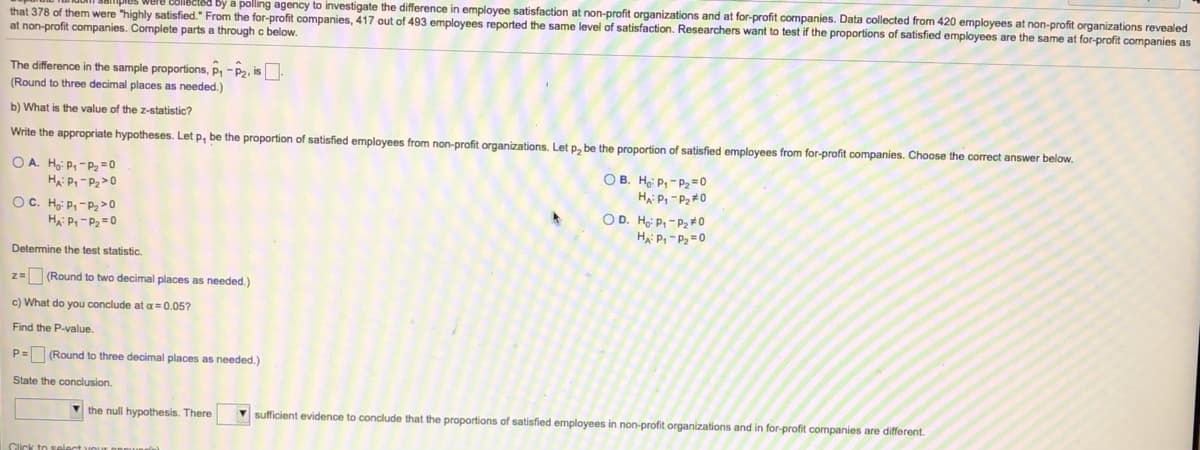
Transcribed Image Text:lected by a polling agency to investigate the difference in employee satisfaction at non-profit organizations and at for-profit companies. Data collected from 420 employees at non-profit organizations revealed
that 378 of them were "highly satisfied." From the for-profit companies, 417 out of 493 employees reported the same level of satisfaction. Researchers want to test if the proportions of satisfied employees are the same at for-profit companies as
at non-profit companies. Complete parts a through c below.
The difference in the sample proportions, P, -P2, is
(Round to three decimal places as needed.)
b) What is the value of the Z-statistic?
Write the appropriate hypotheses. Let p, be the proportion of satisfied employees from non-profit organizations. Let p, be the proportion of satisfied employees from for-profit companies. Choose the correct answer below.
O A. H: P,-P2 = 0
O B. He P- P2 =0
OC. H: P,-P2>0
Ha P,-P2 =0
OD. Hoi P, - Pz#0
HA P,- P2=0
Determine the test statistic.
z= (Round to two decimal places as needed.)
c) What do you conclude at a=0.05?
Find the P-value.
P= (Round to three decimal places as needed.)
State the conclusion.
the null hypothesis. There
V sufficient evidence to conclude that the proportions of satisfied employees in non-profit organizations and in for-profit companies are different.
Expert Solution
This question has been solved!
Explore an expertly crafted, step-by-step solution for a thorough understanding of key concepts.

This is a popular solution!

Trending now
This is a popular solution!

Step by step
Solved in 4 steps with 6 images

Knowledge Booster


Learn more about
Need a deep-dive on the concept behind this application? Look no further. Learn more about this topic, statistics and related others by exploring similar questions and additional content below.Recommended textbooks for you
Glencoe Algebra 1, Student Edition, 9780079039897…
Algebra
ISBN:
9780079039897
Author:
Carter
Publisher:
McGraw Hill

Big Ideas Math A Bridge To Success Algebra 1: Stu…
Algebra
ISBN:
9781680331141
Author:
HOUGHTON MIFFLIN HARCOURT
Publisher:
Houghton Mifflin Harcourt

Holt Mcdougal Larson Pre-algebra: Student Edition…
Algebra
ISBN:
9780547587776
Author:
HOLT MCDOUGAL
Publisher:
HOLT MCDOUGAL
Glencoe Algebra 1, Student Edition, 9780079039897…
Algebra
ISBN:
9780079039897
Author:
Carter
Publisher:
McGraw Hill
Big Ideas Math A Bridge To Success Algebra 1: Stu…
Algebra
ISBN:
9781680331141
Author:
HOUGHTON MIFFLIN HARCOURT
Publisher:
Houghton Mifflin Harcourt
Holt Mcdougal Larson Pre-algebra: Student Edition…
Algebra
ISBN:
9780547587776
Author:
HOLT MCDOUGAL
Publisher:
HOLT MCDOUGAL