We are interested in looking at the effect of a baseball player’s free-agent status on their salary. We look at 337 baseball players and categorize them as either having a high salary (above 2 million) or not, and as either being free agents or not. 1. Verify the expected counts using the equation: expected = row total x column total / (divided by) table total 2. At a significance level of .05, what can you conclude in the context of this problem? 3. Verify the χ2 test statistic using: X2 = ∑ (observed - expected) 2 /(divided by) expected.
We are interested in looking at the effect of a baseball player’s free-agent status on their salary. We look at 337 baseball players and categorize them as either having a high salary (above 2 million) or not, and as either being free agents or not. 1. Verify the expected counts using the equation: expected = row total x column total / (divided by) table total 2. At a significance level of .05, what can you conclude in the context of this problem? 3. Verify the χ2 test statistic using: X2 = ∑ (observed - expected) 2 /(divided by) expected.

Linear Algebra: A Modern Introduction
4th Edition
ISBN:9781285463247
Author:David Poole
Publisher:David Poole
Chapter4: Eigenvalues And Eigenvectors
Section4.6: Applications And The Perron-frobenius Theorem
Problem 22EQ

Related questions
Topic Video
Question
We are interested in looking at the effect of a baseball player’s free-agent status on their salary. We look at 337 baseball players and categorize them as either having a high salary (above 2 million) or not, and as either being free agents or not.
1. Verify the expected counts using the equation: expected = row total x column total / (divided by) table total
2. At a significance level of .05, what can you conclude in the context of this problem?
3. Verify the χ2 test statistic using: X2 = ∑ (observed - expected) 2 /(divided by) expected.
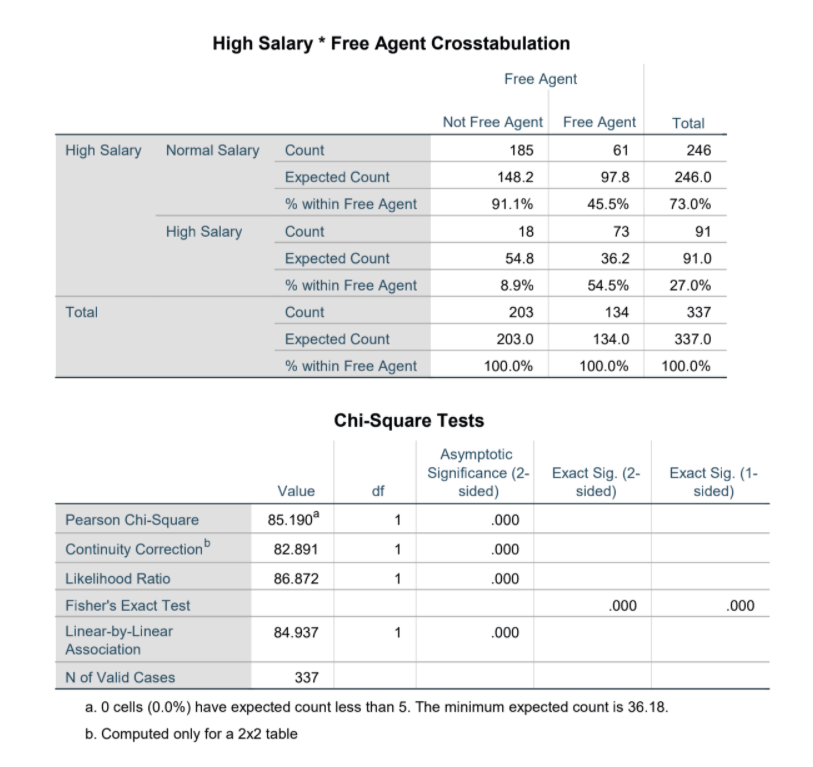
Transcribed Image Text:High Salary * Free Agent Crosstabulation
Free Agent
Not Free Agent Free Agent
Total
High Salary Normal Salary Count
185
61
246
Expected Count
148.2
97.8
246.0
% within Free Agent
91.1%
45.5%
73.0%
High Salary
Count
18
73
91
Expected Count
54.8
36.2
91.0
% within Free Agent
8.9%
54.5%
27.0%
Total
Count
203
134
337
Expected Count
203.0
134.0
337.0
% within Free Agent
100.0%
100.0%
100.0%
Chi-Square Tests
Asymptotic
Significance (2- Exact Sig. (2-
sided)
Exact Sig. (1-
sided)
Value
df
sided)
Pearson Chi-Square
85.190°
1
.000
Continuity Correctionb
82.891
.000
1
Likelihood Ratio
86.872
1
.000
Fisher's Exact Test
.000
.000
Linear-by-Linear
Association
84.937
1
.000
N of Valid Cases
a. O cells (0.0%) have expected count less than 5. The minimum expected count is 36.18.
337
b. Computed only for a 2x2 table
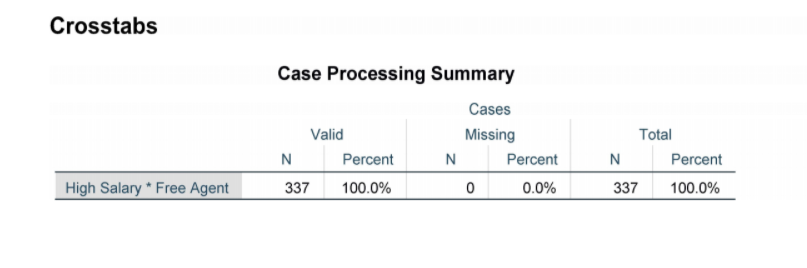
Transcribed Image Text:Crosstabs
Case Processing Summary
Cases
Valid
Missing
Total
N
Percent
N
Percent
N
Percent
High Salary * Free Agent
337
100.0%
0.0%
337
100.0%
Expert Solution
This question has been solved!
Explore an expertly crafted, step-by-step solution for a thorough understanding of key concepts.

Step by step
Solved in 3 steps

Knowledge Booster


Learn more about
Need a deep-dive on the concept behind this application? Look no further. Learn more about this topic, statistics and related others by exploring similar questions and additional content below.Recommended textbooks for you
Linear Algebra: A Modern Introduction
Algebra
ISBN:
9781285463247
Author:
David Poole
Publisher:
Cengage Learning

Functions and Change: A Modeling Approach to Coll…
Algebra
ISBN:
9781337111348
Author:
Bruce Crauder, Benny Evans, Alan Noell
Publisher:
Cengage Learning
Linear Algebra: A Modern Introduction
Algebra
ISBN:
9781285463247
Author:
David Poole
Publisher:
Cengage Learning
Functions and Change: A Modeling Approach to Coll…
Algebra
ISBN:
9781337111348
Author:
Bruce Crauder, Benny Evans, Alan Noell
Publisher:
Cengage Learning