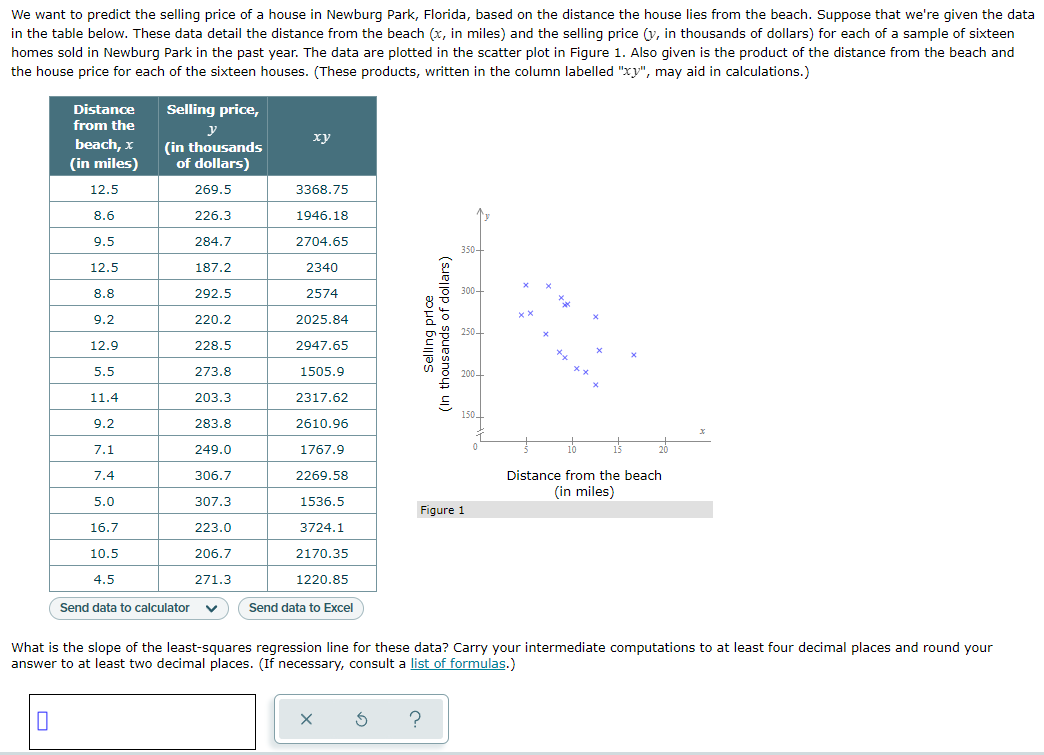
We want to predict the selling price of a house in Newburg Park, Florida, based on the distance the house lies from the beach. Suppose that we're given the data in the table below. These data detail the distance from the beach (x, in miles) and the selling price (v, in thousands of dollars) for each of a sample of sixteen homes sold in Newburg Park in the past year. The data are plotted in the scatter plot in Figure 1. Also given is the product of the distance from the beach and the house price for each of the sixteen houses. (These products, written in the column labelled "xy", may aid in calculations.) Selling price, y Distance from the beach, x (in miles) xy (in thousands of dollars) 12.5 269.5 3368.75 8.6 226.3 1946.18 9.5 284.7 2704.65 350- 12.5 187.2 2340 8.8 292.5 2574 300- 9.2 220.2 2025.84 250- 12.9 228.5 2947.65 5.5 273.8 1505.9 11.4 203.3 2317.62 9.2 283.8 2610.96 7.1 249.0 1767.9 7.4 306.7 2269.58 Distance from the beach (in miles) 5.0 307.3 1536.5 Figure 1 16.7 223.0 3724.1 10.5 206.7 2170.35 4.5 271.3 1220.85 Send data to calculator V Send data to Excel What is the slope of the least-squares regression line for these data? Carry your intermediate computations to at least four decimal places and round your answer to at least two decimal places. (If necessary, consult a list of formulas.) Selling price (In thousands of dollars)
We want to predict the selling price of a house in Newburg Park, Florida, based on the distance the house lies from the beach. Suppose that we're given the data in the table below. These data detail the distance from the beach (x, in miles) and the selling price (v, in thousands of dollars) for each of a sample of sixteen homes sold in Newburg Park in the past year. The data are plotted in the scatter plot in Figure 1. Also given is the product of the distance from the beach and the house price for each of the sixteen houses. (These products, written in the column labelled "xy", may aid in calculations.) Selling price, y Distance from the beach, x (in miles) xy (in thousands of dollars) 12.5 269.5 3368.75 8.6 226.3 1946.18 9.5 284.7 2704.65 350- 12.5 187.2 2340 8.8 292.5 2574 300- 9.2 220.2 2025.84 250- 12.9 228.5 2947.65 5.5 273.8 1505.9 11.4 203.3 2317.62 9.2 283.8 2610.96 7.1 249.0 1767.9 7.4 306.7 2269.58 Distance from the beach (in miles) 5.0 307.3 1536.5 Figure 1 16.7 223.0 3724.1 10.5 206.7 2170.35 4.5 271.3 1220.85 Send data to calculator V Send data to Excel What is the slope of the least-squares regression line for these data? Carry your intermediate computations to at least four decimal places and round your answer to at least two decimal places. (If necessary, consult a list of formulas.) Selling price (In thousands of dollars)

ChapterP: Prerequisites
SectionP.6: The Rectangular Coordinate System And Graphs
Problem 2ECP

Related questions
Question
Transcribed Image Text:We want to predict the selling price of a house in Newburg Park, Florida, based on the distance the house lies from the beach. Suppose that we're given the data
in the table below. These data detail the distance from the beach (x, in miles) and the selling price (v, in thousands of dollars) for each of a sample of sixteen
homes sold in Newburg Park in the past year. The data are plotted in the scatter plot in Figure 1. Also given is the product of the distance from the beach and
the house price for each of the sixteen houses. (These products, written in the column labelled "xy", may aid in calculations.)
Selling price,
Distance
from the
beach, x
(in miles)
y
(in thousands
xy
of dollars)
12.5
269.5
3368.75
8.6
226.3
1946.18
9.5
284.7
2704.65
350-
12.5
187.2
2340
8.8
300+
292.5
2574
9.2
220.2
2025.84
250+
12.9
228.5
2947.65
5.5
273.8
1505.9
200-
11.4
203.3
2317.62
150+
9.2
283.8
2610.96
7.1
249.0
1767.9
15
7.4
306.7
2269.58
Distance from the beach
(in miles)
5.0
307.3
1536.5
Figure 1
16.7
223.0
3724.1
10.5
206.7
2170.35
4.5
271.3
1220.85
Send data to calculator V
Send data to Excel
What is the slope of the least-squares regression line for these data? Carry your intermediate computations to at least four decimal places and round your
answer to at least two decimal places. (If necessary, consult a list of formulas.)
0
X
S ?
Selling price
(In thousands of dollars)
xx
Expert Solution
This question has been solved!
Explore an expertly crafted, step-by-step solution for a thorough understanding of key concepts.

Step by step
Solved in 3 steps with 3 images

Recommended textbooks for you

Trigonometry (MindTap Course List)
Trigonometry
ISBN:
9781337278461
Author:
Ron Larson
Publisher:
Cengage Learning

Functions and Change: A Modeling Approach to Coll…
Algebra
ISBN:
9781337111348
Author:
Bruce Crauder, Benny Evans, Alan Noell
Publisher:
Cengage Learning
Trigonometry (MindTap Course List)
Trigonometry
ISBN:
9781337278461
Author:
Ron Larson
Publisher:
Cengage Learning
Functions and Change: A Modeling Approach to Coll…
Algebra
ISBN:
9781337111348
Author:
Bruce Crauder, Benny Evans, Alan Noell
Publisher:
Cengage Learning

Holt Mcdougal Larson Pre-algebra: Student Edition…
Algebra
ISBN:
9780547587776
Author:
HOLT MCDOUGAL
Publisher:
HOLT MCDOUGAL