We want to test the null hypothesis that population mean = 10. Using the following observations, calculate the t-test statistic value. Observations are 9, 10, 4, 5, 6, 7, 8. OA-3.67 O B. 3.67 OC.4.90 O D.4.90
We want to test the null hypothesis that population mean = 10. Using the following observations, calculate the t-test statistic value. Observations are 9, 10, 4, 5, 6, 7, 8. OA-3.67 O B. 3.67 OC.4.90 O D.4.90

Glencoe Algebra 1, Student Edition, 9780079039897, 0079039898, 2018
18th Edition
ISBN:9780079039897
Author:Carter
Publisher:Carter
Chapter10: Statistics
Section10.3: Measures Of Spread
Problem 23PFA

Related questions
Question
100%
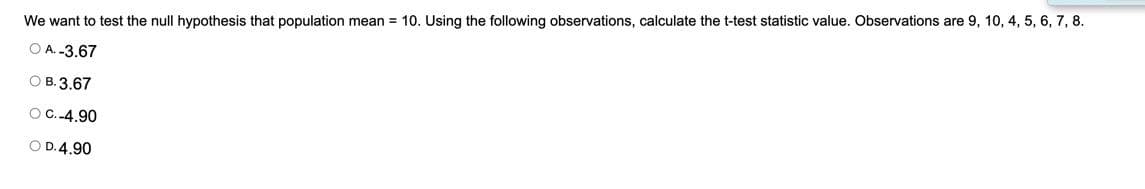
Transcribed Image Text:We want to test the null hypothesis that population mean = 10. Using the following observations, calculate the t-test statistic value. Observations are 9, 10, 4, 5, 6, 7, 8.
O A. -3.67
О В. 3.67
O C.-4.90
O D.4.90
Expert Solution
This question has been solved!
Explore an expertly crafted, step-by-step solution for a thorough understanding of key concepts.

Step by step
Solved in 2 steps with 1 images

Recommended textbooks for you
Glencoe Algebra 1, Student Edition, 9780079039897…
Algebra
ISBN:
9780079039897
Author:
Carter
Publisher:
McGraw Hill
Glencoe Algebra 1, Student Edition, 9780079039897…
Algebra
ISBN:
9780079039897
Author:
Carter
Publisher:
McGraw Hill