Weatherwise is a magazine published by the American Meteorological Society. One issue gives a rating system used to classify Nor'easter storms that frequently hit New England and can cause much damage near the ocean. A severe storm has an average peak waye height of 164 feet for waves hitting the shore. Suppose that a Nor'easter is in progress at the severe storm class rating. Peak wave heights are u ally n the severe rating? Use a-0.01. from la (a) What is the level of significance? State the null and alternate hypotheses Ho 16.4 ft; H:>16.4 ft Ho: < 16.4 ft; H:= 16.4 ft Ho: = 16.4 t; H < 16.4 ft Ho: > 16.4 ft; H:- 16.4 ft Ho: - 16.4 ft; H: 16.4 ft (b) What sampling distribution will you use? Explain the rationale for your choice of sampling distribution. The standard normal, since the sample size is large and e is known. The standard normal, since the sample size is large and e is unknown. The Student's t, since the sample size is large and e is unknown. The Student's t, since the sample size is large and e is known. What is the value of the sample test statistic? (Round your answer to two decimal places.) (c) Estimate the P-value. P-value > 0.250 0.100 < P-value < 0.250 0.050 < P-value < 0.100 0.010 < P-value < 0.050 Pvalue < 0.010 Sketch the sampling distribution and show the area corresponding to the Pvalue. -2 -1 2 eionificant at level a?
Weatherwise is a magazine published by the American Meteorological Society. One issue gives a rating system used to classify Nor'easter storms that frequently hit New England and can cause much damage near the ocean. A severe storm has an average peak waye height of 164 feet for waves hitting the shore. Suppose that a Nor'easter is in progress at the severe storm class rating. Peak wave heights are u ally n the severe rating? Use a-0.01. from la (a) What is the level of significance? State the null and alternate hypotheses Ho 16.4 ft; H:>16.4 ft Ho: < 16.4 ft; H:= 16.4 ft Ho: = 16.4 t; H < 16.4 ft Ho: > 16.4 ft; H:- 16.4 ft Ho: - 16.4 ft; H: 16.4 ft (b) What sampling distribution will you use? Explain the rationale for your choice of sampling distribution. The standard normal, since the sample size is large and e is known. The standard normal, since the sample size is large and e is unknown. The Student's t, since the sample size is large and e is unknown. The Student's t, since the sample size is large and e is known. What is the value of the sample test statistic? (Round your answer to two decimal places.) (c) Estimate the P-value. P-value > 0.250 0.100 < P-value < 0.250 0.050 < P-value < 0.100 0.010 < P-value < 0.050 Pvalue < 0.010 Sketch the sampling distribution and show the area corresponding to the Pvalue. -2 -1 2 eionificant at level a?

Glencoe Algebra 1, Student Edition, 9780079039897, 0079039898, 2018
18th Edition
ISBN:9780079039897
Author:Carter
Publisher:Carter
Chapter4: Equations Of Linear Functions
Section4.5: Correlation And Causation
Problem 2CYU

Related questions
Question
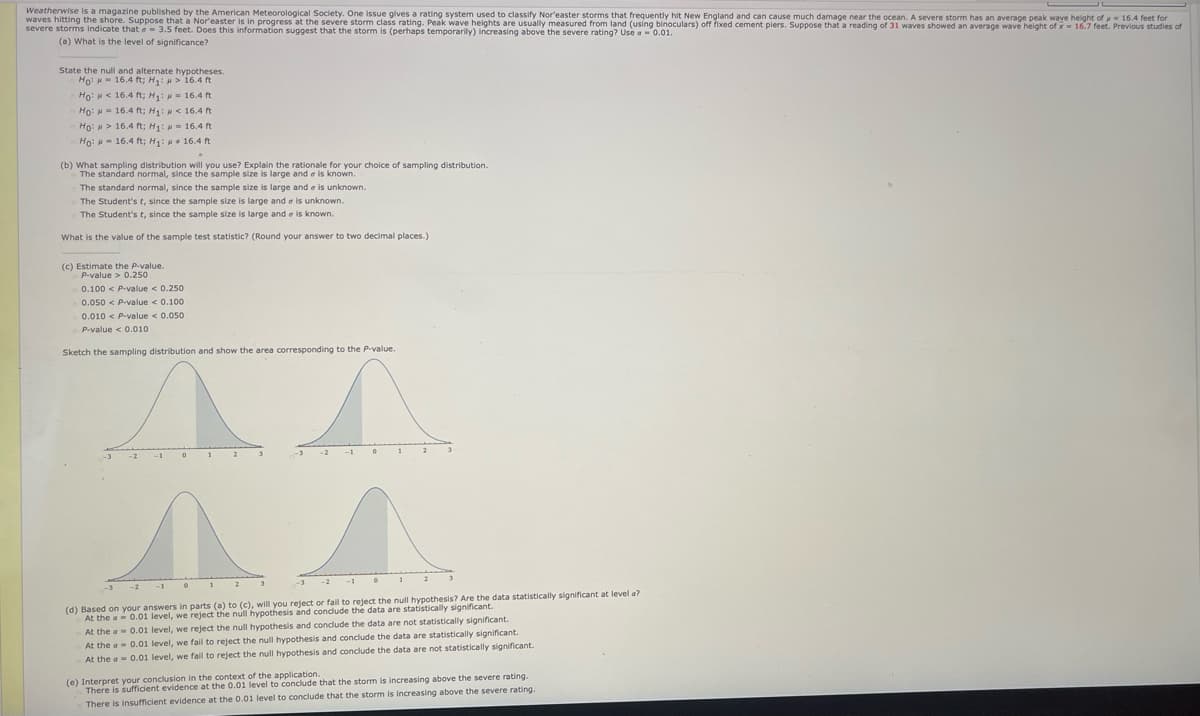
Transcribed Image Text:severe storms indicate that e3.5 feet. Does this information suggest that the storm is (perhaps temporarily) increasing above the severe rating? Use off fxed cement piers. Suppose that a reading of 31 waves showed an average wave height of x= 16.7 feet. Previous studies of
Weatherwise is a magazine published by the American Meteorological Society. One issue gives a rating system used to classify Nor'easter storms that frequently hit New England and can cause much damage near the ocean. A severe storm has an average peak wave height of 164 feet for
waves hitting the shore. Suppose that a Nor'easter is in progress at the severe storm class rating. Peak wave heights are usually measured from land C
(a) What is the level of significance?
State the null and alternate hypotheses.
Ho: H- 16.4 ft; H:>'16.4 ft
Ho: H< 16.4 ft; H1: = 16.4 ft
Ho: H 16.4 ft; H1: N< 16.4 ft
Ho: H> 16.4 ft; H1: = 16.4 ft
Ho: H- 16.4 ft; H: H+ 16.4 ft
(b) What sampling distribution will you use? Explain the rationale for your choice of sampling distribution.
The standard normal, since the sample size is large and e is known.
The standard normal, since the sample size is large and e is unknown.
The Student's t, since the sample size is large and e is unknown.
The Student's t, since the sample size is large and e is known.
What is the value of the sample test statistic? (Round your answer to two decimal places.)
(c) Estimate the P-value.
P-value > 0.250
0.100 < P-value < 0.250
0.050 < P-value < 0.100
0.010 < P-value < 0.050
P-value < 0.010
Sketch the sampling distribution and show the area corresponding to the P-value.
(d) Based on your answers in parts (a) to (c), will you reject or fail to reject the null hypothesis? Are the data statistically significant at level a?
At the a- 0.01 level, we reject the null hypothesis and condlude the data are statistically significant.
At the a 0.01 level, we reject the null hypothesis and condude the data are not statistically significant.
At the a- 0.01 level, we fail to reject the null hypothesis and conclude the data are statistically significant.
At the a= 0.01 level, we fail to reject the null hypothesis and conclude the data are not statistically significant.
(e) Interpret your conclusion in the context of the application.
There is sufficient evidence at the 0.01 level to conclude that the storm is increasing above the severe rating.
There is insufficient evidence at the 0.01 level to conclude that the storm is increasing above the severe rating.
Expert Solution
This question has been solved!
Explore an expertly crafted, step-by-step solution for a thorough understanding of key concepts.

Step by step
Solved in 2 steps with 2 images

Recommended textbooks for you
Glencoe Algebra 1, Student Edition, 9780079039897…
Algebra
ISBN:
9780079039897
Author:
Carter
Publisher:
McGraw Hill

Algebra & Trigonometry with Analytic Geometry
Algebra
ISBN:
9781133382119
Author:
Swokowski
Publisher:
Cengage

Algebra for College Students
Algebra
ISBN:
9781285195780
Author:
Jerome E. Kaufmann, Karen L. Schwitters
Publisher:
Cengage Learning
Glencoe Algebra 1, Student Edition, 9780079039897…
Algebra
ISBN:
9780079039897
Author:
Carter
Publisher:
McGraw Hill
Algebra & Trigonometry with Analytic Geometry
Algebra
ISBN:
9781133382119
Author:
Swokowski
Publisher:
Cengage
Algebra for College Students
Algebra
ISBN:
9781285195780
Author:
Jerome E. Kaufmann, Karen L. Schwitters
Publisher:
Cengage Learning

Intermediate Algebra
Algebra
ISBN:
9781285195728
Author:
Jerome E. Kaufmann, Karen L. Schwitters
Publisher:
Cengage Learning


Holt Mcdougal Larson Pre-algebra: Student Edition…
Algebra
ISBN:
9780547587776
Author:
HOLT MCDOUGAL
Publisher:
HOLT MCDOUGAL