Q: Examine the accomplished graph below. a.) Give a good caption or title to the graph. b.) Provide an…
A: The equilibrium point is the point where sellers want to sells the amount that is demanded by the…
Q: Use the following diagram to answer this question
A: Open Market Operations is defined as an operation which lets the Fed buy or sell securities to the…
Q: 10. A pet shop had a 220% increase in sales of turtles in 2008 over the previous year's sales. If…
A: 10.
Q: Draw a graph of the following function: y= e^x/(1+e^x)
A:
Q: 1. Complete the following table. Units TFC TVC TC AFC AVC AC MC 24 1 24 28 24 54 3 24 75 24 96 126 6…
A: Since you have asked multiple questions, we will solve the first question for you. If you want any…
Q: Write economic scale note
A: Internal economies of scale occur when a corporation reduces expenses within itself, and they are…
Q: explain segmented bar chart
A: Bar charts: It refers to the chart in which the data is shown with the help of rectangular bars.…
Q: Explain the relationship between AC and MC.
A: The average total cost is the ratio of the total cost of production and the quantity of output…
Q: 1. The cost in dollars, of producing x golf balls is given by: C(x) = 0.35x + 64 000 The average…
A: Answer -
Q: How to make graph in economics
A: Graphs helps us to visualize the data. Sometimes data is too complicated to elaborate then…
Q: Is mo represented by this graph? 1000 500 333 250 200
A: Fixed cost remains same at each unit of output production Variable cost keeps changing as output…
Q: could you elaborate? or might as well explain the graph?
A: The economics as a study is based upon the idea that the resources which are present with the…
Q: Draw AFC, AVC, AC, and MC on a graph
A: It is important to know the terms before showing them on the graph: AFC: Average fixed cost can be…
Q: 2) Looking back at the TC and TVC costs what would the graph look like? (You don't have to plot any…
A: Total cost is the sum of total fixed cost and total variable costs.
Q: Which of the following explains the change on the graph?
A: Given, The demand curve shows the association between the amounts of commodity demanded by the…
Q: an you please draw the graph
A: Note:Drawing the Graph only, since you asked to draw the graph out of all the questions The Income…
Q: A food manufacturer produces several ingredients for a taco linner including taco shells, taco meat…
A: The price point at which the merchant's total profit is maximized. This price point is called…
Q: What is the expected profit if Jesaki Inc. produces and sells 6,180 widgets? Round to the nearest…
A: Given Total cost function: C(x)=210+12x ... (1) Total revenue function: R(x)=…
Q: show graph for the following, thanks
A: In the mentioned question we have been asked to carve the variable cost, total cost function on the…
Q: 7. A company that sells toys models their profit with the function P(x) = -4x + 32x? -64. Their…
A: Profit function P(x) = -4x3+32x2-64 .................(1) where x >0 ( since quantity can not be…
Q: Hi! What would a and b look like if illustrated in a graph?
A: Given:- Qd=1600-300P Qs=1400+700P To form:- Graphs for part(a) and (b)
Q: Make a bar graph for the chart below
A: Given: Fork Spoon Knife Lentil 14 15 1 Bean 17 16 2 Noodle 8 10 2
Q: 26.When isoquants get progressively closer together there is Select one: a. increasing returns to…
A: Any consistent level of output is shown by an isoquant curve which breakdown to the meaning of equal…
Q: Experiment with manipulating the shape of the line given on the following graph by selecting and…
A: There is no graph to answer the question.
Q: interpret the data in the graph
A: The above graph shows the transactions amount of customers and income of bank customers.
Q: A measure calculated by taking the ratio of output to input.
A: Inputs are the resources hired for running the production process and it includes resources like…
Q: When I entered my answer in my online math assigment it said it was wrong
A: We use this formula to solve the above problem: A = P(1 + r)t where A is the amount that you get…
Q: Consider the CEO of a company that sells coffee at small free standing shops around the country. The…
A:
Q: On a tour guide map of Madagascar, the scale states that 3 inches represents 125 miles. Two beaches…
A: 3 inches= 125 miles
Q: Calculate the value of TR when average revenue is 30 and no of units employed is 10
A: # total revenue is calculated bye by the product of average revenue and the number of units employed…
Q: Isoquant curves Gym requires exactly 3 bottles of water per athlete to maximise performance…
A: Introduction Isoquant curve : Isoquant curve represents all the inputs combinations of two…
Q: need the part (d) only graph . All other parts are already solved you refer this n plot the graph
A:
Q: Explain Isoquant curve. Explain Isocost line. The difference between the two and what should be…
A: Answer: Isoquant curve: it is a curve that shows different combinations of capital and labor that…
Q: can you please do the graph
A:
Q: If i=10% Find the value of F of this diagram.
A: Given Interest rate = 10 % Future worth = Net cashflows * (1 + rate)^time
Q: USeP Graduating students can improve their prospects of employment after graduation either by…
A: Isocost curve: It refers to the different combinations of the inputs that result in the same total…
Q: Define analysis,
A: Analysis: - it is the process of examining complex things to understand their nature.
Q: The following diagram is an example of a
A: Supply is the total quantity of products and services that the producer manufacture to sell in the…
Q: Refer to the figure below:
A: The given graph shows the consumption and the investment in different years and in some years the…
Q: how to graph this
A: Price is given and quantity of imports demanded.We have to draw demand and supply curves on y axis…
Q: ТР Number of workers Refer to the graph above. With efficient production, this firm can maximize…
A: A firm produce efficiently at where TP is maximum.
Q: question part c should contain a graph
A: Part c
Q: PLOT FC, VC, TC, MC, AFC AND AVC in one graph
A: TC ( Total Cost ) refer to the total expenses incurred to produce goods and services during a…
Q: May I have a better diagram for this question pleas and thank you!
A: Given Initial investment or principal value = $16,211.85 After 6 year, Blue Spruce Motel will…
Q: answer
A:
What can be concluded from the graph?
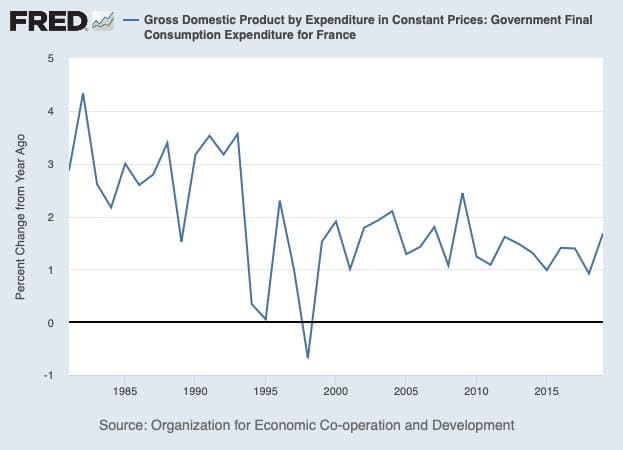
Trending now
This is a popular solution!
Step by step
Solved in 3 steps
- Cross country comparisons of GDP per capita typically use purchasing power parity equivalent exchange rates, which are a measure of the long run equilibrium value of an exchange rate. In fact, we used PPP equivalent exchange rates in this module. Why could using market exchange rates, which sometimes change dramatically in a short period of time, be misleading?Use the following composition of expenditure for the economy of a country named the Republic of Tapuwa, for the year ended 2019 to answer the questions below:COMPONENTR millionsConsumption expenditure (C) Investment (I)Government spending (G) Exports (X)Imports (Z)DepreciationForeign payment to the rest of the worldForeign payment from the rest of the worldShow all calculations and formulae.9 000 6 500 7 000 1 800 2 400 700 300250 Compute the value for the country’s GDP (Gross Domestic Product) at market price. Determine the value of the country’s NNI (Net National Income) at market price.If it is predicted that the GDP will increase to 22 000 in 2020, calculate the growth rate between 2019 and 2020.Q.7.2.5The measure of GDP for economic growth is not always perfect. Describe any two problems that are associated with GDP as a measure of economic growth.1. Calculate the value of nominal GDP for 2004.a. PHP800b. P1,060c. P1,200d. P1,460 *base year is 2003
- The following data relate to an emerging African country.Item Value('000) KSHSGNP 8,000,000 Depreciation 100,000Indirect Business Taxes 80,000Gross Investment 400,000Total population 30,000Consumption 10,000Personal Income Taxes 800Excise duty 80Personal Income 89,000Net factor incomes from abroad 200,000 Using the above data, calculate: Net National Product and GNP per capita Net investment and Disposable personal income Gross domestic productYear Cost of basket (R) of consumer goods / services Base Year 2018 1850 2019 2190 2020 2380 2021 2560 Use the information in Table to measure the consumer price indexfor 2019, 2020 and 2021 respectively.Show your calculations and round off to two decimal places. Show how gross national product (GNI) can be derived from gross domesticproduct (GDP). Explain, with the aid of an equation, the components of the consumptionfunction.Depreciation 200 Exports 150 public transfer 200 Gross domestic private investment 300 corporate income tax 100 factor receipts from abroad 400 gevenment expenditure on goods and services 250 interest income 800 compensation of employees 2600 net interest on government debit 50 indirect business taxes 100 factor payments to abroad 200 imports 200 proprietors incom(profits) 700 retained corporate profit 200 personal consumption expenditure 4500 personal taxes 100 social security contribution 50 rental income 600. From the above data find personale disposable income.
- Differentiate between GNP and GDP.Also Find out GNP at factor cost of thegiven data.The net domestic product at market price of an economy is Rs.4500cr. Thecapital stock worth Rs.4000cr and it depreciates at the rate of 10% per annum. Netindirect tax amount to Rs.130cr,factor income from rest of the world is 400cr. And torest of the world is 600 cr.Gross Domestic Product is caiculated by multiplying the quantities of goods by their prices because it allows us to______ A) express the values of products in a common unit of measurement B) overcome the problems of comparing the output of one country to that of another C) calculate the total number of physical units of products produced in an economy D) correct for inflationWhich of these is not a characteristic of the gross domestic product? a. Includes intermediate goods b. Calculated every accounting year c. Value of all final goods and services d. Expressed in terms of money
- Real gross domestic product Select one: a. measures the value of final goods and services produced within the borders of a given country during a given time period using current prices. b. measures the value of final goods and services produced within the borders of a given country during a given time period corrected for changing prices. c. is a measure of the overall level of prices. d. can change from one year to the next even if there is no change in output.Calculate National income if:- GNP at MP = $3000 Depreciation = $2000 Net indirect taxes = $500government purchases $15 pesonal consumption 80 gross investment 29 consumption of fixed capital (depreciation) 5 exports 8 imports 12 Refer to the accompaning data (all figures in billion dollars) GDP is?