What does it mean if a company ratio's are below or above industry average? Please see attached scans depicting company data and industry averages
What does it mean if a company ratio's are below or above industry average? Please see attached scans depicting company data and industry averages

College Accounting, Chapters 1-27
23rd Edition
ISBN:9781337794756
Author:HEINTZ, James A.
Publisher:HEINTZ, James A.
Chapter10: Accounting For Sales And Cash Receipts
Section: Chapter Questions
Problem 3MC

Related questions
Question
What does it mean if a company ratio's are below or above industry average?
Please see attached scans depicting company data and industry averages.
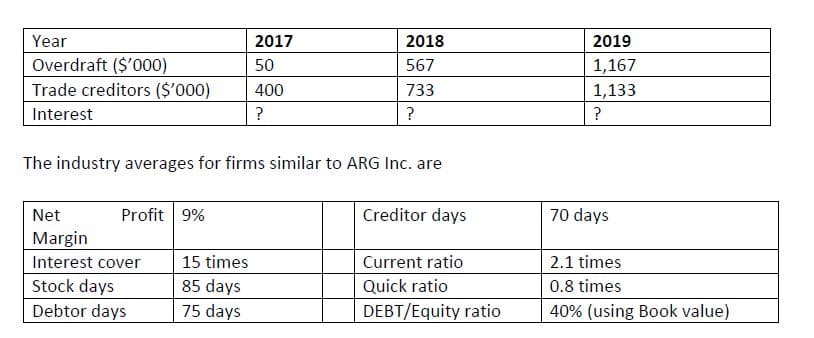
Transcribed Image Text:Year
2017
2018
2019
Overdraft ($'000)
50
567
1,167
Trade creditors ($'000)
400
733
1,133
Interest
?
?
The industry averages for firms similar to ARG Inc. are
Net
Profit 9%
Creditor days
70 days
Margin
Interest cover
15 times
Current ratio
2.1 times
Stock days
85 days
75 days
Quick ratio
0.8 times
Debtor days
DEBT/Equity ratio
40% (using Book value)
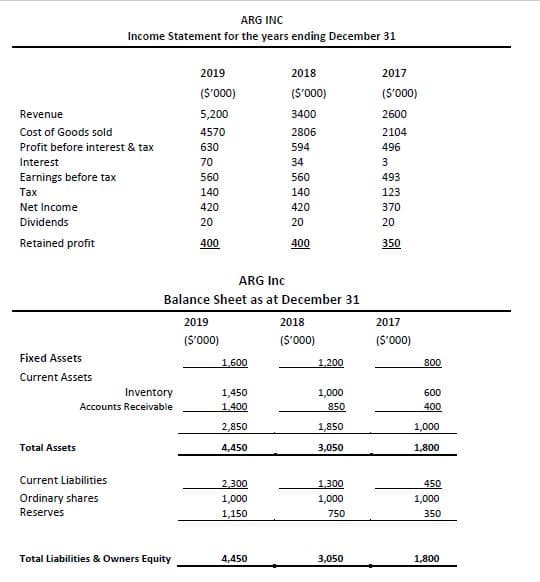
Transcribed Image Text:ARG INC
Income Statement for the years ending December 31
2019
2018
2017
(S'000)
(S'000)
(S'000)
Revenue
5,200
3400
2600
Cost of Goods sold
4570
2806
2104
Profit before interest & tax
630
594
496
Interest
70
34
3
Earnings before tax
Tax
560
140
560
493
140
123
Net Income
420
420
370
Dividends
20
20
20
Retained profit
400
400
350
ARG Inc
Balance Sheet as at December 31
2019
2018
2017
(S'000)
(S'000)
(S'000)
Fixed Assets
1.600
1,200
800
Current Assets
Inventory
Accounts Receivable
1,450
1,000
600
1.400
850
400
2,850
1,850
1,000
Total Assets
4,450
3,050
1,800
Current Liabilities
2.300
1,300
450
Ordinary shares
1,000
1,000
1,000
Reserves
1,150
750
350
Total Liabilities & Owners Equity
4,450
3,050
1,800
Expert Solution
This question has been solved!
Explore an expertly crafted, step-by-step solution for a thorough understanding of key concepts.

Step by step
Solved in 2 steps

Knowledge Booster


Learn more about
Need a deep-dive on the concept behind this application? Look no further. Learn more about this topic, finance and related others by exploring similar questions and additional content below.Recommended textbooks for you
College Accounting, Chapters 1-27
Accounting
ISBN:
9781337794756
Author:
HEINTZ, James A.
Publisher:
Cengage Learning,


Survey of Accounting (Accounting I)
Accounting
ISBN:
9781305961883
Author:
Carl Warren
Publisher:
Cengage Learning
College Accounting, Chapters 1-27
Accounting
ISBN:
9781337794756
Author:
HEINTZ, James A.
Publisher:
Cengage Learning,
Survey of Accounting (Accounting I)
Accounting
ISBN:
9781305961883
Author:
Carl Warren
Publisher:
Cengage Learning