What does the z-score of a data point tell us?

Glencoe Algebra 1, Student Edition, 9780079039897, 0079039898, 2018
18th Edition
ISBN:9780079039897
Author:Carter
Publisher:Carter
Chapter10: Statistics
Section10.3: Measures Of Spread
Problem 26PFA

Related questions
Question
solve question 1 asap within 15 mins or else downvote
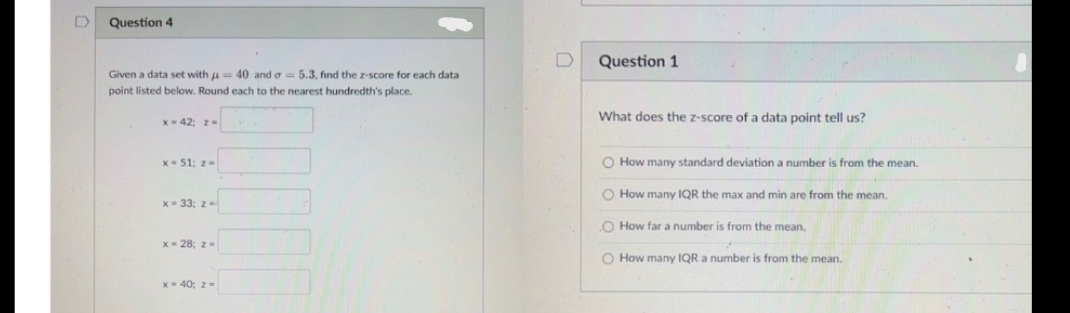
Transcribed Image Text:Question 4
Given a data set with = 40 and o= 5.3, find the z-score for each data
point listed below. Round each to the nearest hundredth's place.
x=42; z-
x-51; z-
x=33; 2-
x=28; 2-
x=40; z-
D
Question 1
What does the z-score of a data point tell us?
O How many standard deviation a number is from the mean.
O How many IQR the max and min are from the mean.
O How far a number is from the mean.
O How many IQR a number
from the mean.
Expert Solution
This question has been solved!
Explore an expertly crafted, step-by-step solution for a thorough understanding of key concepts.

Step by step
Solved in 2 steps

Recommended textbooks for you
Glencoe Algebra 1, Student Edition, 9780079039897…
Algebra
ISBN:
9780079039897
Author:
Carter
Publisher:
McGraw Hill

Big Ideas Math A Bridge To Success Algebra 1: Stu…
Algebra
ISBN:
9781680331141
Author:
HOUGHTON MIFFLIN HARCOURT
Publisher:
Houghton Mifflin Harcourt
Glencoe Algebra 1, Student Edition, 9780079039897…
Algebra
ISBN:
9780079039897
Author:
Carter
Publisher:
McGraw Hill
Big Ideas Math A Bridge To Success Algebra 1: Stu…
Algebra
ISBN:
9781680331141
Author:
HOUGHTON MIFFLIN HARCOURT
Publisher:
Houghton Mifflin Harcourt