What is H3? The mean of group O is the same as the mean of group 1 The mean of group 0 is not the same as the mean of group 1 O The mean math achievement score for boys is not different than the mean math achievement score for girls O The mean math achievement score for boys is different than the mean math achievement score for girls O The mean math achievement score for boys is the same as the mean math achievement score for girls The mean math achievement score for boys is not the same as the mean math achievement score for girls O The mean math achievement score for boys is equal to the mean math achievement score for girls O The mean math achievement score for boys is not equal to the mean math achievement score for girls O Ho is not true
What is H3? The mean of group O is the same as the mean of group 1 The mean of group 0 is not the same as the mean of group 1 O The mean math achievement score for boys is not different than the mean math achievement score for girls O The mean math achievement score for boys is different than the mean math achievement score for girls O The mean math achievement score for boys is the same as the mean math achievement score for girls The mean math achievement score for boys is not the same as the mean math achievement score for girls O The mean math achievement score for boys is equal to the mean math achievement score for girls O The mean math achievement score for boys is not equal to the mean math achievement score for girls O Ho is not true

Glencoe Algebra 1, Student Edition, 9780079039897, 0079039898, 2018
18th Edition
ISBN:9780079039897
Author:Carter
Publisher:Carter
Chapter10: Statistics
Section10.6: Summarizing Categorical Data
Problem 10CYU

Related questions
Question
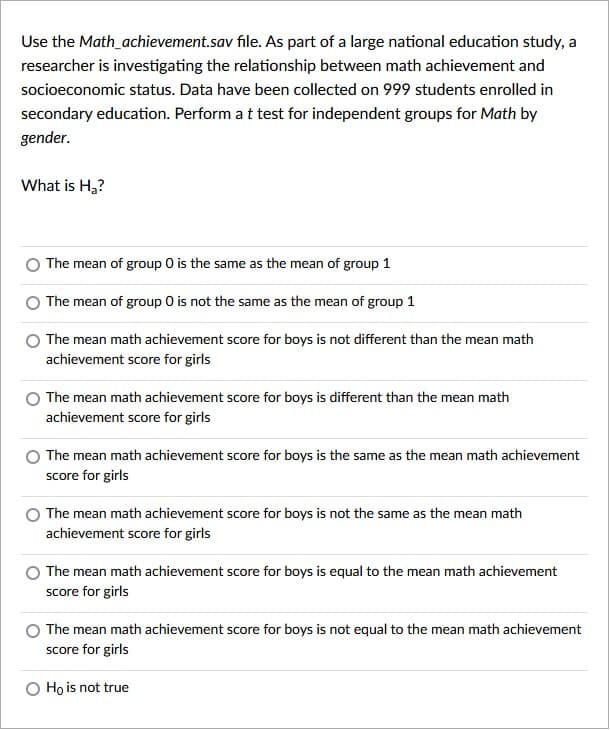
Transcribed Image Text:Use the Math_achievement.sav file. As part of a large national education study, a
researcher is investigating the relationship between math achievement and
socioeconomic status. Data have been collected on 999 students enrolled in
secondary education. Perform at test for independent groups for Math by
gender.
What is H,?
The mean of group 0 is the same as the mean of group 1
The mean of group 0 is not the same as the mean of group 1
The mean math achievement score for boys is not different than the mean math
achievement score for girls
The mean math achievement score for boys is different than the mean math
achievement score for girls
The mean math achievement score for boys is the same as the mean math achievement
score for girls
The mean math achievement score for boys is not the same as the mean math
achievement score for girls
The mean math achievement score for boys is equal to the mean math achievement
score for girls
The mean math achievement score for boys is not equal to the mean math achievement
score for girls
O Ho is not true
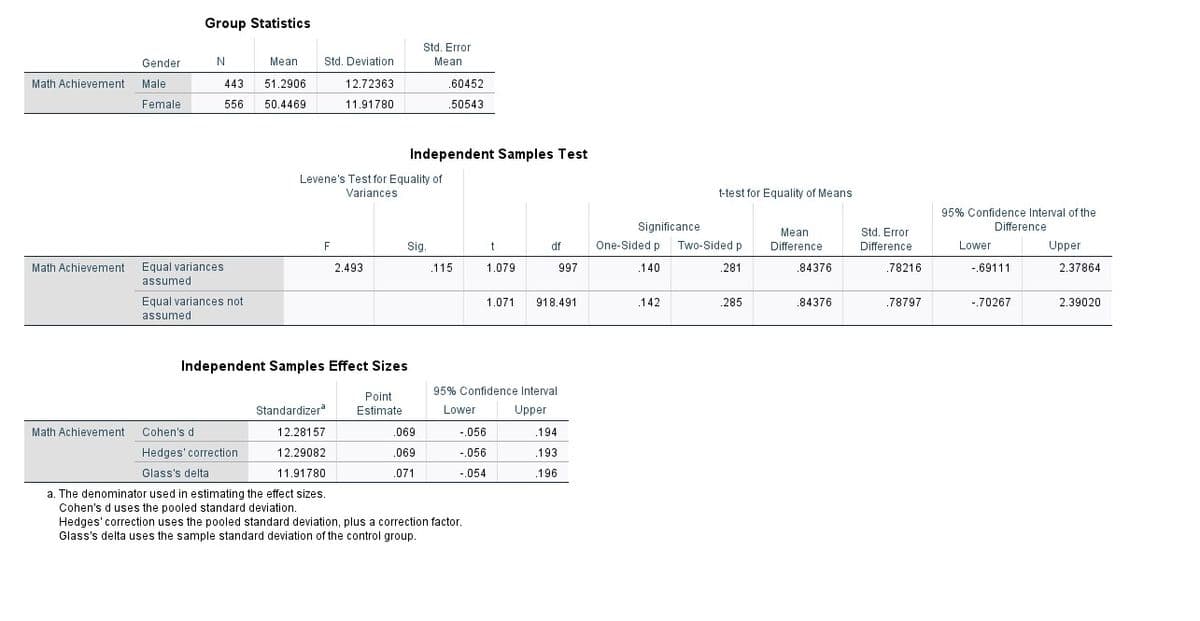
Transcribed Image Text:Group Statistics
Std. Error
Gender
N
Mean
Std. Deviation
Mean
Math Achievement
Male
443
51.2906
12.72363
.60452
Female
556
50.4469
11.91780
.50543
Independent Samples Test
Levene's Test for Equality of
Variances
t-test for Equality of Means
95% Confidence Interval of the
Significance
Difference
Mean
Difference
Std. Error
F
Sig.
t
df
One-Sided p
Two-Sided p
Difference
Lower
Upper
Math Achievement
Equal variances
2.493
.115
1.079
997
.140
.281
.84376
78216
-.69111
2.37864
assumed
Equal variances not
1.071
918.491
.142
.285
.84376
.78797
-.70267
2.39020
assumed
Independent Samples Effect Sizes
95% Confidence Interval
Point
Standardizera
Estimate
Lower
Upper
Math Achievement
Cohen's d
12.28157
.069
-.056
.194
Hedges' correction
12.29082
.069
-.056
.193
Glass's delta
11.91780
.071
-.054
.196
a. The denominator used in estimating the effect sizes.
Cohen's d uses the pooled standard deviation.
Hedges' correction uses the pooled standard deviation, plus a correction factor.
Glass's delta uses the sample standard deviation of the control group.
Expert Solution
This question has been solved!
Explore an expertly crafted, step-by-step solution for a thorough understanding of key concepts.

Step by step
Solved in 2 steps

Recommended textbooks for you
Glencoe Algebra 1, Student Edition, 9780079039897…
Algebra
ISBN:
9780079039897
Author:
Carter
Publisher:
McGraw Hill

Holt Mcdougal Larson Pre-algebra: Student Edition…
Algebra
ISBN:
9780547587776
Author:
HOLT MCDOUGAL
Publisher:
HOLT MCDOUGAL
Glencoe Algebra 1, Student Edition, 9780079039897…
Algebra
ISBN:
9780079039897
Author:
Carter
Publisher:
McGraw Hill
Holt Mcdougal Larson Pre-algebra: Student Edition…
Algebra
ISBN:
9780547587776
Author:
HOLT MCDOUGAL
Publisher:
HOLT MCDOUGAL