What is relation between product tolerance (engineering tolerance) and process variation.? Explain in some details showing some representation
What is relation between product tolerance (engineering tolerance) and process variation.? Explain in some details showing some representation

Elements Of Electromagnetics
7th Edition
ISBN:9780190698614
Author:Sadiku, Matthew N. O.
Publisher:Sadiku, Matthew N. O.
ChapterMA: Math Assessment
Section: Chapter Questions
Problem 1.1MA

Related questions

Question
Question 4
- What is relation between product tolerance (engineering tolerance) and process variation.? Explain in some details showing some representation.
- Analyze the following study in terms:
- Components of variations and their contributions
- X Chart and R Chart
3.
Calculate the process capability (show your method). Is it acceptable? Comment on this result.
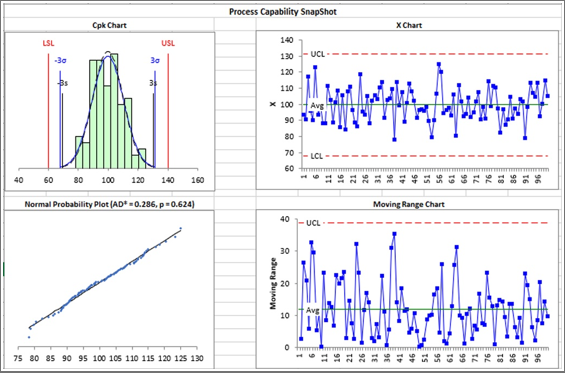
Transcribed Image Text:Process Capability SnapShot
Cpk Chart
X Chart
140
LSL
USL
130
UCL-
-30
30
120
110
х 100
Avg
90
80
70
LCL
60
40
60
80
100
120
140
160
Normal Probability Plot (AD* =0.286, p=0.624)
Moving Range Chart
40
UCL
30
20
10
0 t m m
75 80 85 90 95 100 105 110 115 120 125 130
99
95
TS
TE
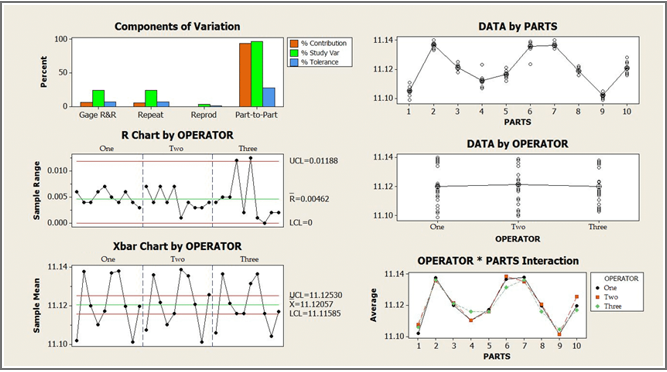
Transcribed Image Text:Components of Variation
DATA by PARTS
100-
6 Contrbution
% Study Var
% Tolerance
11.14
11.12
50-
11.10
Gage R&R
Repeat
Reprod
Part-to-Part
1
2
8
10
PARTS
R Chart by OPERATOR
Two
DATA by OPERATOR
One
Three
11.144
UCL=0.01188
0.010 -
11.12-
0.005-
R=0.00462
11.10-
0.000 -
La=0
One
Two
Three
OPERATOR
Xbar Chart by OPERATOR
One
Two
Three
OPERATOR * PARTS Interaction
11.14-
11.14
OPERATOR
UCL-11.12530
X-11.12057
LCL-11.11585
One
- Two
Three
11.12-
11.12-
11.10
11.10-
2
7
8.
9 10
PARTS
Sample Mean
Sample Range
Percent
Average
Expert Solution
This question has been solved!
Explore an expertly crafted, step-by-step solution for a thorough understanding of key concepts.

Step by step
Solved in 2 steps

Knowledge Booster


Learn more about
Need a deep-dive on the concept behind this application? Look no further. Learn more about this topic, mechanical-engineering and related others by exploring similar questions and additional content below.Recommended textbooks for you
Elements Of Electromagnetics
Mechanical Engineering
ISBN:
9780190698614
Author:
Sadiku, Matthew N. O.
Publisher:
Oxford University Press

Mechanics of Materials (10th Edition)
Mechanical Engineering
ISBN:
9780134319650
Author:
Russell C. Hibbeler
Publisher:
PEARSON

Thermodynamics: An Engineering Approach
Mechanical Engineering
ISBN:
9781259822674
Author:
Yunus A. Cengel Dr., Michael A. Boles
Publisher:
McGraw-Hill Education
Elements Of Electromagnetics
Mechanical Engineering
ISBN:
9780190698614
Author:
Sadiku, Matthew N. O.
Publisher:
Oxford University Press
Mechanics of Materials (10th Edition)
Mechanical Engineering
ISBN:
9780134319650
Author:
Russell C. Hibbeler
Publisher:
PEARSON
Thermodynamics: An Engineering Approach
Mechanical Engineering
ISBN:
9781259822674
Author:
Yunus A. Cengel Dr., Michael A. Boles
Publisher:
McGraw-Hill Education

Control Systems Engineering
Mechanical Engineering
ISBN:
9781118170519
Author:
Norman S. Nise
Publisher:
WILEY

Mechanics of Materials (MindTap Course List)
Mechanical Engineering
ISBN:
9781337093347
Author:
Barry J. Goodno, James M. Gere
Publisher:
Cengage Learning

Engineering Mechanics: Statics
Mechanical Engineering
ISBN:
9781118807330
Author:
James L. Meriam, L. G. Kraige, J. N. Bolton
Publisher:
WILEY