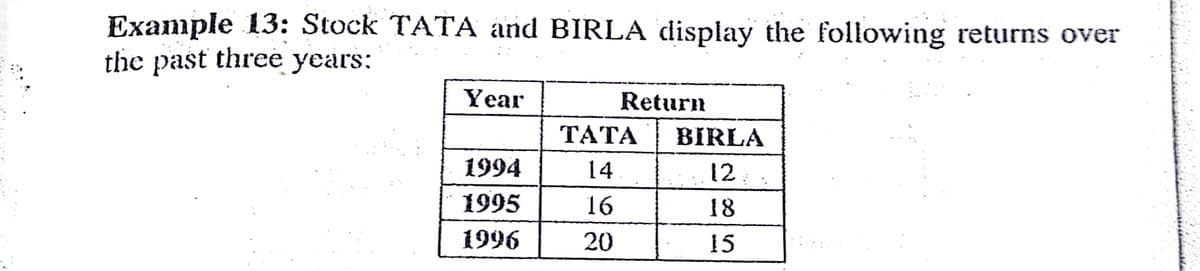
what is the correlation coefficient of stock TATA and BIRLA?


Q: In conclusion, what can we say regarding Spearman Rank Correlation Coefficient?
A:
Q: If an observed correlation value is -.45 and the table value for Pearson Correlation is 450 for a…
A: Here, the observed correlation value is -0.45. The table value for Pearson correlation is 0.45.…
Q: What effect does Switzerland have on the correlation? Explain.
A: Correlation is a statistical term describing the degree to which two variables move in coordination…
Q: What is the squared curvilinear correlation coefficient?
A: Correlation: The extent of linear relation between two variables is known as correlation and denoted…
Q: Describe about Pearson Correlation Coefficient.
A: The Pearson correlation coefficient is the measure of association which is computed to find the…
Q: What is the best correlational test to use in SPSS for a research sample size of 39?
A: A correlation coefficient is a value that shows how closely two sets of measurements are related. It…
Q: What are the key properties of correlation coefficient?
A: Correlation is measure of linear association between two quantitative variables. The variables are…
Q: Why should researchers be very cautious about comparison of correlations that involve different…
A: Researchers should be very cautious about comparisons of correlations that involve different…
Q: A researcher wants to find if there are associations between heart diseases and several variables.…
A: Association between the variables can be established if both the variables are categorical.…
Q: What is Population Correlation Coefficient, ρ?
A:
Q: i. Sketch a scatter diagram of the data and interpret the correlation coefficient.
A: Scatter Diagram (i) insert →scatter plot
Q: What are the possible ranges of the correlation coefficient
A: We know that the correlation coefficient is the measure of the degree of linear association between…
Q: What is correlation in regards to psychology?
A: Correlation is a technique that shows the strength of the relationship and whether a pair of…
Q: Hello, What is the difference between a correlation coefficient and the coefficient of…
A: Correlation:Correlation a measure which indicates the “go-togetherness” of two data sets. It can be…
Q: A study of 20 worldwide financial institutions showed the correlation between their assets and…
A: In usual notations, The sample size n=20, The sample correlation coefficient r=0.86, and level of…
Q: Does a high positive correlation between smoking and lung cancer and prove that one cause to…
A: Introduction: Correlation: Correlation is a measure of the strength of linear association between…
Q: sed on a two-tailed t-test,what will be the conclusion of the significance test for this correlation…
A: From there results of first question, the correlation value is 0.97.
Q: Because there is a strong positive correlation between depression and risk of divorce, we can…
A: Given: Strong positive correlation between depression and risk of divorce then depression cause…
Q: What information is provided by the numerical value of the Pearson correlation?
A: From the given question, Correlation coefficient:
Q: 8) Why should researchers be very cautious about comparison of correlations that involve different…
A: There are several possible explanations when a strong correlation is observed between two variables…
Q: 11. What is the value of Spearman's correlation coefficient for the association between chocolate…
A: Given chocolate consumption(R1) nobel prize (R2) 4.5 5.5 8.5 24.4 4.4 8.6 2.9 0 3.9…
Q: What are the assumptions for t test for the population correlation coefficient?
A: Correlation: Correlation is the measure of association between two variables in which one variable…
Q: provided by calculations of a Pearson’s Correlation Coefficient?
A: Given that, Pearson’s Correlation Coefficient: The Pearson correlation coefficient is used to…
Q: What is the importance of correlation coefficient?
A: Correlation coefficients are used to measure the strength of the relationship between two variables.…
Q: As sample size gets smaller, what happens to the magnitude of the correlation necessary for…
A: Magnitude of Correlations is the absolute value of r which represents the strength of association.…
Q: Make up a data set with 10 numbers that has a positive correlation?
A:
Q: What is negatively correlated?
A:
Q: What does experimental confirmation of a correlation?
A:
Q: What is a point bacterial correlation coefficient?
A: The correlation coefficient is the measure of how strong is the linear relationship with two…
Q: Determine whether a significant degree of rank correlation exists, using desired significance level.…
A: The hypothesis is, Null hypothesis: H0: There is no significant degrees of rank correlation exists.…
Q: What is Partial Squared Curvilinear Correlation?
A:
Q: f correlation does not imply causation, what does it imply?
A: "Correlation does not imply causation"is a phrase used in statistics to emphasize that a correlation…
Q: What is the value of Spearman's rank correlation coefficient for the data:
A: To calculate the Spearman rank correlation coefficient, first we rank the observations of both…
Q: What is a correlation coefficient and state and explain the meaning of negative values in the…
A: Regression models are used to predict/forecast the value of dependent variable at some certain…
Q: List two possible limitations of using a Pearson correlation coefficient.
A: Two limitations of correlations when interpreting the data are: 1. One of the limitations of the…
Q: Colorblind Although some women are colorblind, thiscondition is found primarily in men. Why is it…
A: Correlation measures the strength of linear association between the variables. However, it suffers…
Q: Suppose that you want to do statistical significance tests for four correlations and you want your…
A: It is given that the number of correlation is 4 and EWa is 0.05.
Q: Suppose a researcher found that the correlation between a test he or she developed and job…
A: Introduction: Suppose r is the sample correlation coefficient between two variables, based on a…
Q: How to Compute the standard error using Pearson's correlation?
A: The test statistic to test the sample correlation is as follows:
Q: What is the “third factor” problem concerning correlational studies as it relates to inferring…
A: The correlation between any two variables is the linear relationship between those variables, but it…
Q: 1. What information is provided by the sign ( or –) of the Pearson correlation?
A:
Q: 2) Test for a linear correlation between Midterm and Overall Grade.
A: The objective is to test for a linear correlation between Midterm and Overall Grade.
Q: If the correlation coefficient is 0.8, the percentage of variation in the response variable…
A: Given: correlation coefficient =0.8
Q: What information is provided by the numerical value of the Pearson correlation?
A: Pearson's numerical value, or magnitude of correlation, informs the strength of the relationship…
Q: from a correlation?
A: How Causation May Be Wrongly Inferred from Correlation: Common causal: When we talk about a…
Q: Explain the difference between Pearson and Spearman correlation coefficient. What is the meaning of…
A: The Karl Pearson’s product-moment correlation coefficient or simply, the Pearson’s correlation…
Q: When compared with the Pearson correlation, the Spearman correlation coefficient is: Less…
A: Given information: The comparison of Pearson correlation coefficient and spearm.an correlation…
what is the

Step by step
Solved in 2 steps with 2 images

- A manufacturer of exercise equipment knows that 15% of their products aredefective. They also know that only 35% of their customers will actually use the equipment in the first year after it is purchased. If there is a one-year warranty on the equipment, what proportion of the customers will actually make a valid warranty claim?In a staff meeting called to address the problem of returned cheques at the supermarkets where you areinterning as a financial analyst, the bank reports that 12 percent of all cheques are returned for insufficientfunds, and of those, in those 50 percent of cases, there was cash given back to the customer. overall ,10percent of customers ask for cash back at the end of their transaction with the store. For 1,000 customervisits, how many transactions will involve: (f) insufficient funds?(g) Cash back to the customer?(h) Both insufficient funds and cashback?(i) Either insufficient funds or cash back?b) You decide to buy 10,000 shares of each company. If the covariance between ABC and XYZ is 0, what is the expected return and standard deviation of your portfolio over the next year? 1
- A random sample of companies in electric utilities (I), financial services (II), and food processing (III) gave the following information regarding annual profits per employee (units in thousands of dollars). I II III 49.9 55.4 39.2 43.9 25.0 37.5 32.7 41.9 10.1 27.8 29.6 32.6 38.1 39.6 15.7 36.5 42.3 20.5 Find SSTOT, SSBET, and SSW and check that SSTOT = SSBET + SSW. (Use 3 decimal places.) SSTOT = SSBET = SSW = Find d.f.BET, d.f.W, MSBET, and MSW. (Use 3 decimal places for MSBET, and MSW.) dfBET = dfW = MSBET = MSW = Find the value of the sample F statistic. (Use 3 decimal places.) What are the degrees of freedom? Find the P-value of the sample test statistic. Make a summary table for your ANOVA test.Month Madison Cookies Sophie Electric 1 -0.04 0.07 2 0.06 -0.02 3 -0.07 -0.10 4 0.12 0.15 5 -0.02 -0.06 6 0.05 0.02 Standard deviation of returns for each stockSuppose a world has two risky assets: HotPot and IceCream. The following table shows the holding period returns in each scenario. Suppose the T-bill rate is 5%. Scenario Probability Return (HotPot) Return (IceCream) Rainy 0.02 10% -5% Snowy 0.03 15% -15% Windy 0.9 10% 8% Sunny 0.05 -10% 25% Which answer is the closest value to the fifth-percentile value at risk (VaR) of holding IceCream? A. -15% B. -5% C. 25% D. -10%
- An insurance company offers its policyholders a number of different premium payment options. For a randomly selected policyholder, let X = the number of months between successive payments.An insurance company offers its policyholders a number of different premium payment options. For a randomly selected policyholder, let X = the number of months between successive paymentA random sample of annual percentage returns for mutual funds holding short-term U.S. government bonds is shown below. 4.5 4.6 1.8 9.8 -0.8 4.1 10.5 4.2 3.5 3.9 9.8 -1.2 7.3 Use a calculator to verify that s2 ≈ 14.047 for the preceding data.A random sample of annual percentage returns for mutual funds holding intermediate-term corporate bonds is shown below. -0.1 3.4 20.5 7.6 -0.1 18.8 -3.4 10.5 8.0 -0.9 2.6 14.9 -6.5 8.2 18.8 14.2 Use a calculator to verify that s2 ≈ 71.648 for returns from mutual funds holding intermediate-term corporate bonds.Use ? = 5% to test the claim that the population variance for annual percentage returns of mutual funds holding short-term government bonds is different from the population variance for mutual funds holding intermediate-term corporate bonds. How could your test conclusion relate to the question of reliability of returns for each type of mutual fund? (a) What is the level of significance? b) Find the value of the sample F…
- Suppose 58.8% of small businesses experience cash flow problems in their first 5 years. A consultant takes a random sample of 557 businesses that have been opened for 5 years or less. What is the probability that greater than 55.85% of the businesses have experienced cash flow problems? Question 2 options: 1) 0.9214 2) 0.5000 3) -6.0341 4) 0.0786 5) >0.999Rework problem 27 from section 4.1 of your text involving a poll of registered voters. Assume that 40 percent of voters are Republicans, 35 percent are Democrats, and 25 percent are Independents. A poll taker asks 9 people at random for their party affiliation. Assume further that, because the city is so large, this situation can be approximated by a Bernoulli process. What is the probability that at least 7 of those polled are Democrat voters?Marine biologists have noticed that the color of the outermost growth band on a clam tends to be related to the time of year in which the clam dies. A biologist conducted a small investigation of whether this is true for the species Protothaca staminea. She collected a sample of 55 clam shells in February and 55 clam shells in March. 14 of the shells from February had a dark color on the outermost growth band, whereas 8 of the shells from March had a dark color on the outermost growth band. Carry out a hypothesis test to see if there is a difference in the proportion of shells with a dark outermost growth band between the two months; specifically, if the population proportion in February is higher than March. Let ? = 0.1.Note: Do all calculations as February - MarchA) The point estimate for the true difference in proportion of dark growth bands between February and March is: Note: answer using 4 decimal precisionB) The test statistic, ztest, is: Note: answer using 2 decimal…
