What is the t-test stat for correlation for the following problem?
Glencoe Algebra 1, Student Edition, 9780079039897, 0079039898, 2018
18th Edition
ISBN:9780079039897
Author:Carter
Publisher:Carter
Chapter10: Statistics
Section10.4: Distributions Of Data
Problem 19PFA
Related questions
Question
100%
What is the t-test stat for

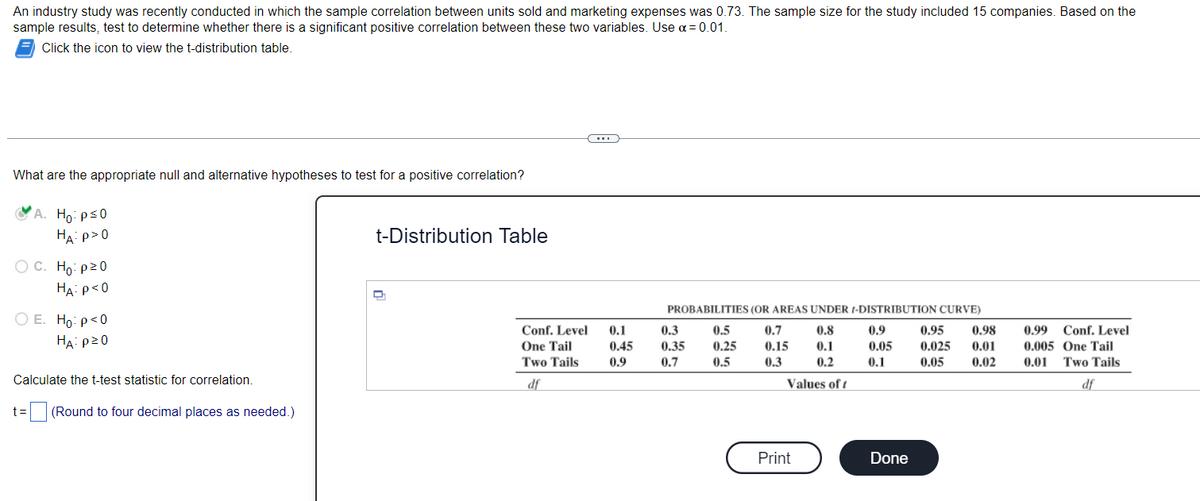
Transcribed Image Text:An industry study was recently conducted in which the sample correlation between units sold and marketing expenses was 0.73. The sample size for the study included 15 companies. Based on the
sample results, test to determine whether there is a significant positive correlation between these two variables. Use α=0.01.
Click the icon to view the t-distribution table.
What are the appropriate null and alternative hypotheses to test for a positive correlation?
A. Ho: p≤0
HA:P>0
OC. Ho: p²0
HA: P<0
O E. Ho: P<0
HA: P²0
Calculate the t-test statistic for correlation.
t= (Round to four decimal places as needed.)
t-Distribution Table
Conf. Level
One Tail
Two Tails
df
0.1
0.45
0.9
PROBABILITIES (OR AREAS UNDER 1-DISTRIBUTION CURVE)
0.5 0.7 0.8
0.25 0.15 0.1
0.5 0.3 0.2
Values of t
0.3
0.35
0.7
Print
0.9
0.05
0.1
Done
0.95 0.98
0.025 0.01
0.05 0.02
0.99 Conf. Level
0.005 One Tail
0.01 Two Tails
df
Expert Solution
This question has been solved!
Explore an expertly crafted, step-by-step solution for a thorough understanding of key concepts.
Step by step
Solved in 3 steps

Follow-up Questions
Read through expert solutions to related follow-up questions below.
Follow-up Question
What is the critical value for the rejection region for the t test stat? Thank you

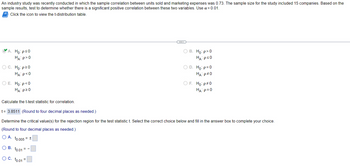
Transcribed Image Text:An industry study was recently conducted in which the sample correlation between units sold and marketing expenses was 0.73. The sample size for the study included 15 companies. Based on the
sample results, test to determine whether there is a significant positive correlation between these two variables. Use α=0.01.
Click the icon to view the t-distribution table.
A. Ho: p≤0
HA:P>0
OC. Ho: p²0
HA: P<0
O E. Ho: p<0
HA: P²0
Calculate the t-test statistic for correlation.
O B. to.01 =
OC. to.01
t= 3.8511 (Round to four decimal places as needed.)
Determine the critical value(s) for the rejection region for the test statistic t. Select the correct choice below and fill in the answer box to complete your choice.
(Round to four decimal places as needed.)
O A. to.005 = ±
==
OB. Ho:p> 0
HA:P≤0
=
O D. Ho: p=0
HA: P#0
OF. Ho: p#0
HA: P=0
Solution
Recommended textbooks for you

Glencoe Algebra 1, Student Edition, 9780079039897…
Algebra
ISBN:
9780079039897
Author:
Carter
Publisher:
McGraw Hill

Glencoe Algebra 1, Student Edition, 9780079039897…
Algebra
ISBN:
9780079039897
Author:
Carter
Publisher:
McGraw Hill