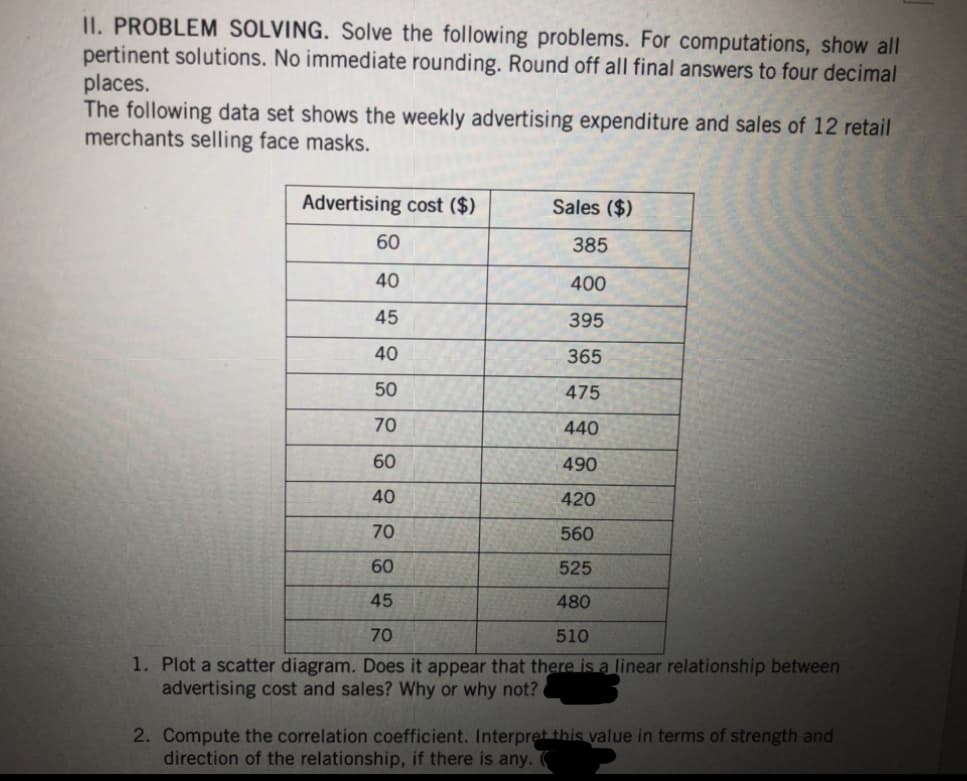
II. PROBLEM SOLVING. Solve the following problems. For computations, show all pertinent solutions. No immediate rounding. Round off all final answers to four decimal places. The following data set shows the weekly advertising expenditure and sales of 12 retail merchants selling face masks. Sales ($) 385 400 395 365 475 440 490 420 560 525 480 70 510 1. Plot a scatter diagram. Does it appear that there is a linear relationship between advertising cost and sales? Why or why not? Advertising cost ($) 60 40 45 40 50 70 60 40 70 60 45 2. Compute the correlation coefficient. Interpret this value in terms of strength and direction of the relationship, if there is any.
II. PROBLEM SOLVING. Solve the following problems. For computations, show all pertinent solutions. No immediate rounding. Round off all final answers to four decimal places. The following data set shows the weekly advertising expenditure and sales of 12 retail merchants selling face masks. Sales ($) 385 400 395 365 475 440 490 420 560 525 480 70 510 1. Plot a scatter diagram. Does it appear that there is a linear relationship between advertising cost and sales? Why or why not? Advertising cost ($) 60 40 45 40 50 70 60 40 70 60 45 2. Compute the correlation coefficient. Interpret this value in terms of strength and direction of the relationship, if there is any.

Algebra: Structure And Method, Book 1
(REV)00th Edition
ISBN:9780395977224
Author:Richard G. Brown, Mary P. Dolciani, Robert H. Sorgenfrey, William L. Cole
Publisher:Richard G. Brown, Mary P. Dolciani, Robert H. Sorgenfrey, William L. Cole
Chapter2: Working With Real Numbers
Section2.3: Rules For Addition
Problem 9P

Related questions
Question
100%
show all solutions. no immediate rounding. round off all final answers to four decimal places
Transcribed Image Text:II. PROBLEM SOLVING. Solve the following problems. For computations, show all
pertinent solutions. No immediate rounding. Round off all final answers to four decimal
places.
The following data set shows the weekly advertising expenditure and sales of 12 retail
merchants selling face masks.
Sales ($)
60
385
40
400
45
395
40
365
50
475
70
440
60
490
40
420
70
560
60
525
45
480
70
510
1. Plot a scatter diagram. Does it appear that there is a linear relationship between
advertising cost and sales? Why or why not?
Advertising cost ($)
2. Compute the correlation coefficient. Interpret this value in terms of strength and
direction of the relationship, if there is any.
Expert Solution
This question has been solved!
Explore an expertly crafted, step-by-step solution for a thorough understanding of key concepts.

Step by step
Solved in 3 steps with 4 images

Follow-up Questions
Read through expert solutions to related follow-up questions below.
Follow-up Question
what is the dependent variable that was considered in the analysis? do you think the dependent variable was chosen reasonably? why?
Solution
Recommended textbooks for you
Algebra: Structure And Method, Book 1
Algebra
ISBN:
9780395977224
Author:
Richard G. Brown, Mary P. Dolciani, Robert H. Sorgenfrey, William L. Cole
Publisher:
McDougal Littell
Algebra: Structure And Method, Book 1
Algebra
ISBN:
9780395977224
Author:
Richard G. Brown, Mary P. Dolciani, Robert H. Sorgenfrey, William L. Cole
Publisher:
McDougal Littell