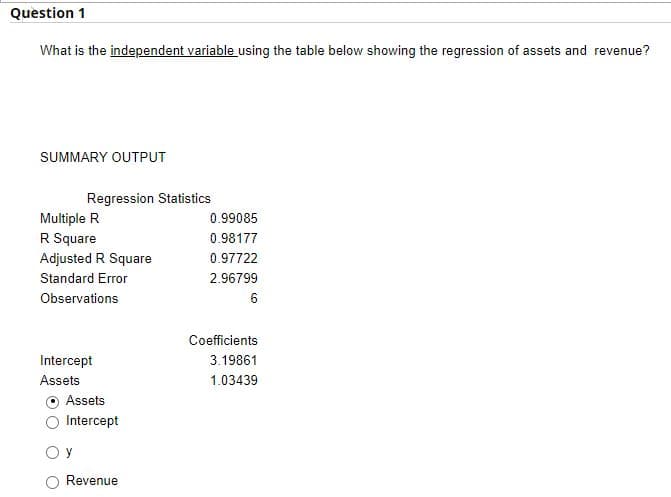
What is the independent variable using the table below showing the regression of assets and revenue?
Q: Compute for Quartile Deviation, Variance, and Coefficient of Variation 12, 24, 25, 25, 19, 19, 24,…
A:
Q: eck for difference in variances? To determine whether the z-table or the t-table should be used. To…
A: Given that ; I solved this question by using the assumptions of difference in means.
Q: Height of adult men are notmally distributed with a mean of 70 inches and a standard deviation of 3…
A:
Q: Compute the standard deviation for the following sample data. Provide answer up to 3 decimal unis.…
A: We have given that the data, 32, 41, 63, 24, 29, 30, 40, 22, 25, 37.
Q: Which one of the following would be a possible p-value for the hypotheses: Ho : μ = 0 versus H1 : μ…
A: Here Given Hypothesis Ho : μ = 0 versus H1 : μ ≠ 0
Q: Problem 2 A class contains seven boys and eight girls. (a) If two are selected at random to leave…
A:
Q: The Honolulu Advertiser stated that in Honolulu there was an average of 661 burglaries per 200,000…
A: Given n=320 P=0.003305
Q: Suppose that P(ω) is a probability distribution on a discrete sample space Ω. Let B ⊂ Ω be an event…
A: Suppose that P(ω) is a probability distribution on a discrete sample space Ω. Let B ⊂ Ω be an…
Q: Job Satisfaction Survey Assignment You will be creating 7 different scales: work, pay, supervision,…
A: Note: As per the guidelines we are allowed to solve single question when multiple questions are…
Q: Find the minimum variance portfolio with expected rate of return of 8% using five assets with…
A: Solution: 12. From the given information, the minimum variance portfolio with expected rate of…
Q: Question 1 The St. Lucian Government is interested in predicting the number of weekly riders on…
A: Introduction: Denote the response variable, number of weekly riders, as y. Denote the explanatory…
Q: you to place a beta(1,9) pr ve tested from the shipmer distribution on the defect
A: Given as, β=1,9, Defect rate=95%.
Q: The ANOVA test for a difference between 3 or more population means is a two- tailed test, but since…
A:
Q: Assume that the following human capital earnings function has been estimated from a sample of…
A: Given the regression equation for human capital earnings function as W=1000+500×S+400×EXP-10×EXP2
Q: 8.78 Given M, = 88, M2 = 85, and sPooled2 = 81.00, (a) calculate d and (b) classify the size of the…
A: Given Information: M1=88 M2=85 SDpooled=81.00
Q: d. How much would a new college graduate in business have to earn in order to have a starting salary…
A: d) The mean and the standard deviation of the starting salary for new college graduates in health…
Q: 1. Suppose a study is conducted to one of the stores in your barangay to determine the factors…
A: Given, Frequency table: A frequency table is a table that summarizes a data set by stating the…
Q: Apart from the usual random errors of measurement, an instrument has one source of bias which cannot…
A:
Q: The following data represent the number of games played in each series of an annual tournament from…
A: Farmula Probability=frequency/(total frequency)
Q: In a negative binomial distribution a. X denote the continuous variables b. X denote the number of…
A: We have given that the statement about to the negative binomial distribution.
Q: The psychologists Daniel Kahneman and Amos Tversky described the following situation: The…
A: Solution: It is needed to give the explanation for the decreased performance for the good execution…
Q: Suppose the parent population X from which we are about to sample is exponential with E(X) = 2. Let…
A: Note: According to Bartleby guidelines expert solve only one question and maximum 3 subpart of the…
Q: Find the central moments µ, and µ̟ and also the coefficients of Skewness and Kurtosis, for a…
A:
Q: 5. For binomial distribution show that, d and hence obtain the first dp four moments about mean. OR…
A:
Q: 8. The distribution of incomes of persons whose incomes exceed 0 cedis per annum is believed to…
A: Find Method of moment MLE θ
Q: Assume an in-control process has provided the following information: n = 4, * = 2.212, R= 0.012 1)…
A: In control Standard deviation: Control limits: Probability to operate outside specification limit:…
Q: one you would normally buy?" Of these users, 62% responded that they would buy the CD. CD with this…
A: Given N=704 Level of significance =0.01
Q: . What are the null and alternative hypotheses? The test statistic, t, is The P-value is State…
A:
Q: The ln (OR) for the unadjusted OR is 1.9685 and the standard error of the ln (OR) is 0.2406. Use…
A: Given information: The ln(OR) for the unadjusted OR is 1.9685. Standard error of the ln(OR) is…
Q: 53.5
A: For sample 1:sample size (n1) = 57sample mean (x̄1) = 49.09sample standard deviation (s1) =…
Q: Conduct an ANOVA test to determine if Subjective well-being (slm_01) differs by Ethnic or cultural…
A: Since we answer only up-to three subparts of a problem, we'll be answering the first three sub…
Q: The claim for a marketing campaign is that 0.55 of clients respond, and you want to prove it is…
A:
Q: A manufacturer is interested at the output voltage of a power supply for the laptop. Output voltage…
A: Given that, a manufacturer is interested at the output voltage of a power supply for the laptop.…
Q: Suppose the variance of house selling prices in both Calgary and Edmonton are known. We are…
A:
Q: (a) The weights (kg) of new bom baby boys in Great Britain is normally distributed with a mean of…
A:
Q: 2) A microwave oven is designed to emit a radiation level of 0.15 through the closed door. The…
A:
Q: Using data from a survey to Stat 201 students, a decision tree can help analyze whether or not a…
A: From the decision tree output, Total number of cheated students is 806. The number of students…
Q: Suppose the variance of house selling prices in both Calgary and Edmonton are known. We are…
A: This question is asked to p value for the hypo. test for the difference between two popl means.…
Q: After collecting considerable data, the engineers decided to model the variation in shaft diameter…
A: Mean(µ) = 10.1Standard deviations (σ) = 2.7X ~ N (µ, σ )= N(10.1, 2.7)
Q: In order to help students improve their study habits, nine students were chosen at random to attend…
A: There are two dependent samples which are before and after seminar. We have to test whether…
Q: ! Required information [The following information applies to the questions displayed below.] Felix &…
A:
Q: Let (¤1, F2, ..., In) be n independent random sample of size n from a uniform distribution on the…
A: Solution: 5. From the given information, x follows uniform distribution with parameters [θ1, θ2].
Q: Find the mean, ?, and standard deviation, ?, for a binomial random variable X. (Round all answers…
A: As per our company guidelines we are supposed to answer only first 3 sub-parts. Kindly repost other…
Q: What does the Central Limit Theorem tell us about the difference in proportions of two random…
A: Here we to identify the correct option according to given statement
Q: You are planning on traveling to 5 cities on a summer vacation. You live in Jack, Alabama (J). You…
A:
Q: 1. Determine whether the following are Qualitative or Quantitative. If Quantitative, classify if it…
A: Qualitative data: The data which cannot be expressed as numerically is called qualitative data.…
Q: At the 5% significance level, determine if the model is useful for predicting the number of weekly…
A: In order to solve this question use Excel. Step.1 Enter data in excel sheet. Step.2 Go to 'Data'…
Q: 5. For binomial distribution show that, d Hx-t = pq| nKµx-1 + dp and hence obtain the first four…
A:
Q: How might investigators doing different types of studies, such as sample surveys and experiments,…
A: Sample size determination in Sample Surveys and experiments
Q: A psychologist is interested in constructing a 95% confidence interval for the proportion of people…
A: Given that
Step by step
Solved in 2 steps
- Cable TV The following table shows the number C. in millions, of basic subscribers to cable TV in the indicated year These data are from the Statistical Abstract of the United States. Year 1975 1980 1985 1990 1995 2000 C 9.8 17.5 35.4 50.5 60.6 60.6 a. Use regression to find a logistic model for these data. b. By what annual percentage would you expect the number of cable subscribers to grow in the absence of limiting factors? c. The estimated number of subscribers in 2005 was 65.3million. What light does this shed on the model you found in part a?What does the y -intercept on the graph of a logistic equation correspond to for a population modeled by that equation?The certain study seeks to investigate whether negative life events, family environment, family violence, media violence, and depression are predictors of youth aggression and bullying. Which of the following statistical tests is most appropriate to answer this objective? a. Linear Regression b. McNemar's Test c. Chi-square Test d. Multiple Logistic Regression
- Which of the following statements is/are correct about logistic regression? Logistic regression can be used for modeling the continuous response variable with dichotomous explanatory variable. Logistic regression can be used for modeling the dichotomous response variable with dichotomous explanatory variable. Logistic regression can be used for modeling the continuous response variable with dichotomous or other type of categorical explanatory variables. Logistic regression can be used for modeling the dichotomous response variable with dichotomous and not for continuous explanatory variables. Logistic regression can be used for modeling the dichotomous response variable with categorical explanatory variables and/or continuous explanatory variables.Which of the following is not one of the statistical assumptions behind linear regression? a. The residuals should not be autocorrelated. b. The variance of Y for all combinations of X variable values should be constant. c. The X variables should be normally distributed. d. The residuals should be normally distributed.