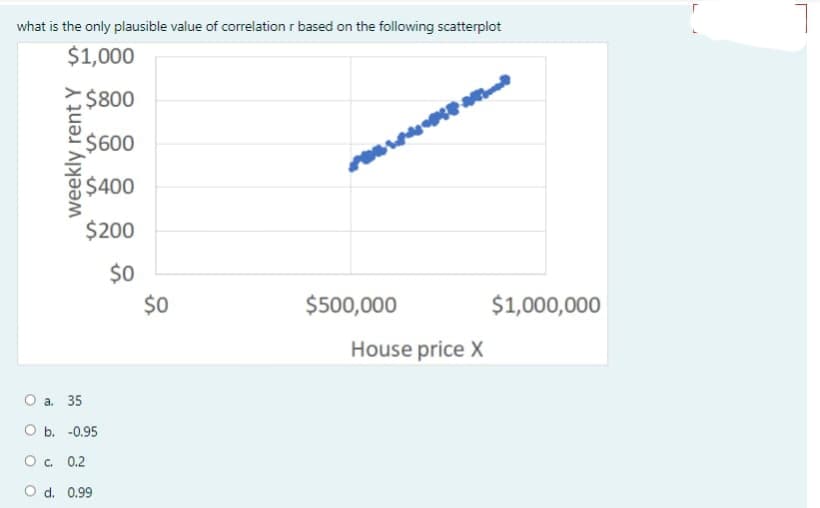
what is the only plausible value of correlation r based on the following scatterplot $1,000 weekly rent Y $800 $600 $400 $200 $0 O a. 35 O b. -0.95 O c. 0.2 d. 0.99 $0 $500,000 KE AT House price X $1,000,000
Q: Classify each characteristic as a qualitative or quantitative: Time Type of car Town of birth…
A: Solution The variables which can be measured numerically is quantitative otherwise they are…
Q: 1. Present pie charts that show the market share within each geographic region. Size the pie charts…
A: a) Construct the pie chart for each of the country separately. Using Excel, following are the steps…
Q: Exercise 4.2. The weights of bags of red gravel may be modeled by a normal distribution with a mean…
A:
Q: If you toss a fair 6-sided die, what is the probability that you get a 1, 2, or 3? (Enter answer as…
A: Ans#- If you toss a fair 6-sided die, what is the probability that you get a 1, 2, or 3?
Q: Exercise 2.2. Find the following probabilities, which are associated with the standard normal random…
A:
Q: Based on the transition matrix and associated diagram below: This year ABCD Next Year A 0.2 0 50 B…
A: Age structured matrix models are a common tool to study the demographics of the future by tracking…
Q: A fair coin is flipped 88 times. Let X be the number of heads. What normal distribution best…
A: Solution-: Let, X=be the number of heads Given: n=Number of times coin flipped=88…
Q: What is the relative frequency of deaths that occurred in 2003 or earlier? State your answer as a…
A: Given that The following frequency table contains the total number of deaths worldwide as a result…
Q: List the elements in roster form, given A = { x Ι x ∈ Ν, and 1 < x ≤ 6}
A: Given A = { x Ι x ∈ Ν, and 1 < x ≤ 6}
Q: Variable Label N X y X Mean Std Dev Minimum Maximum 'speed' 19 39.7368421 15.7650884 15.0000000…
A: Introduction: Denote the true slope corresponding to the predictor x or speed, as β1.
Q: Here is a data set summarized as a stem-and-leaf plot: 6# | 23444599 7# | 0001123444566789 8# |…
A: The stem-and-leaf plot is given.
Q: 2. (b) Date Bio člass, students want to know if the species of plant had any effect on the number of…
A: Given data:
Q: Based on the data derived from the regression analysis, 420 maintenance hours in a month mean that…
A: Under regression analysis, formula for the budgeted total cost isTotal Cost = (Co efficient×hours) +…
Q: Distinguish between qualitative and quantitative variables. Susie was completing a questionnaire for…
A: Distinguish between qualitative and quantitative variables. Susie was completing a questionnaire for…
Q: What is the probability that it has 6 green and 1 red balls?
A: It is given that Green balls = 700 Red balls = 300 Total balls = 1000
Q: A local community college reported that the average SAT score of its students is 960 with a standard…
A: Suppose random variable x defines the SAT score of a student.
Q: Consider a random variable X, with the following empirical pmf. Value X₁ 1 -1 2 IN Probability p(x₁)…
A:
Q: Find the mean of the data summarized in the given frequency Speed (miles per hour) Frequency 42-45…
A: given data speed frequency(f) midpoint(x) f*x 42-45 26 43.5 1131 46-49 12 47.5 570 50-53 6…
Q: c) A research conducted by SSTA022 Class representative at the University of Limpopo indicates that…
A: There are two independent samples which are active and inactive African men. We have to test whether…
Q: 6. The Downtown Marcela Street subway is docked at the station for passengers to enter all morning,…
A:
Q: Determine if the statement is True or False. If a statement is false, explain why Ø = {0}
A: Given that Ø = {0}
Q: Frequency 0515 25 35 45 55 65 75 Age of home (yr) Stamnes & Tabor, The Practice of Statistics, 6e,…
A: convert graph to frequency distribution table. age of home (year) frequency cf 0-5 0 0 5-10…
Q: s the right hand generally stronger than the left hand? Strength is measured by a calibrated…
A: The design in which the subjects under study are assigned completely at random with any of the…
Q: Question Which of the given values is a solution to the equation 8c + 3 = -40c - 10? Select the…
A: Given equation , 8c+3 = -40c-10 We have to find value of c
Q: (b) Find the unweighted mean center, and comment on the differences between your two answers. (c)…
A: Weighted mean center = (3.34, 3.48)
Q: 4. What are the standard deviation and variance of the variable "age"? 5. Construct a relative…
A: Given: Ages, X 20 18 20 18 19 18 21 19
Q: The mean of the frequency distribution is miles per hour [ (Round to the nearest tenth as needed)
A: From given data we have : Speed Frequency (f) 42-45 28 46-49 12 50-53 6 54-57 3 58-61 2
Q: (a) P(Z 1.45)= (d) P(Z > 2.15)=
A: Hi! Thank you for the question, As per the honour code, we are allowed to answer three sub-parts at…
Q: Let A = {4, 5, 7, 8, 9, 10) and B = {2, 4, 8). Indicate if each statement is true or false. 10 € A…
A: With given sets Indicate if each statement is true or false
Q: Exercise 1.3. A normally distributed random variable has a mean of 449: a. If a score of 325 has a…
A:
Q: If A and B are mutually exclusive events, then P(A or B) = P(A)/P(B) P(A or B) =…
A: Answer: From the given data, A and B are mutually exclusive events. Which means A and B are two…
Q: If X is normally distributed with mean μ and variance o2, it is generally described as X~ N(μ,0²).…
A: From the provided information, Mean (µ) = 2 Variance (σ2) = 9 X~N (2, 9)
Q: The Histograms applet displays the travel times to campus in minutes on a particular Tuesday for a…
A: Frequency are the number of times an observation happen. It is also known as count. Histogram are…
Q: Suppose 5 cards are randomly drawn without replacement from 52 card deck. Find the probability of…
A:
Q: The random variable X has probability density function: Solve for the: f(x) = 24 (x²+1), 0, a) the…
A: Since you have posted a question with multiple subparts, we will solve first three subparts for you.…
Q: large population of 5,000 students take a practice test to prepare for a standardized test. The…
A: given data N = 5000μ = 140σ = 80for σx¯ = 10 ; n = ?
Q: a) Are believing that the earth is warming and being a liberal Democrat mutually exclusive? not…
A: a) 0.1800
Q: The following information was obtained from matched samples. (Hint: to calculate differences use…
A: Before After 2 4 4 10 7 9 6 7 3 5
Q: The following stem-and-leaf chart reports the number of movies rented per day at Video Connection:…
A: as per guideline expert have to answer first 3 subparts only. we had given stem and leaf plot…
Q: What is the standard deviation of a variable with the probability distribution X 16 32 p(x) 0.1 0.9…
A:
Q: rom the data table, Calculate/determine the tabulated t-value is ___? A. 2.132 B. 2.571 C. 2.015…
A: tabulated t value is obtained using standard t value at a= 0.05 and n-2= 4 degree of freedom
Q: Let S be the universal set, where: S = {1, 2, 3, ..., 18, 19, 20} Let sets A and B be subsets of S,…
A: Answer:- Given, S be a universal set S = {1, 2, 3, 4, 5, 6, 7, 8, 9, 10, 11, 12, 13,…
Q: 2. Using the data below, what is the slope coefficient from a regression of Quantity on Price? It is…
A: The data set shows quantity and price data set.
Q: Find the median of the following data 8,11,7,9,14,16,3,13,17,21,15
A: Answer: Given data is, 8,11,7,9,14,16,3,13,17,21,15 Sample size (n) = 11 Data in ascending order is…
Q: Let U = {2,4,6,8,10,12} A = {2,4,6,12} B = {6,8,10} C = {2,4,10,12} Determine A - C
A: Solution - Given that Let U = {2,4,6,8,10,12} A = {2,4,6,12} B = {6,8,10} C = {2,4,10,12}…
Q: Q3) a) There are two boxes; the first one has 5 red balls and 7 blue balls while the second box has…
A: There are two boxes. The first box has 5 red balls and 7 blue balls. The second box has 3 red balls…
Q: Mercury in tuna Is there a difference in the mercury concentration of light tuna and albacore tuna?…
A: Please find the explanation below. Thank you.
Q: A group of adult males has foot lengths with a mean of 27.82 cm and a standard deviation of 1.25 cm.…
A: as per guideline expert have to answer first question only. μ = 27.82σ = 1.25
Q: A research conducted by SSTA022 Class representative at the University of Limpopo indicates that…
A: In hypothesis testing, there are always two hypotheses. These are null and alternative hypotheses.…
Q: The answer was right
A: I am solving it again to cross check whether it is right or wrong Class Frequency (f) Mid value…
Step by step
Solved in 2 steps with 2 images