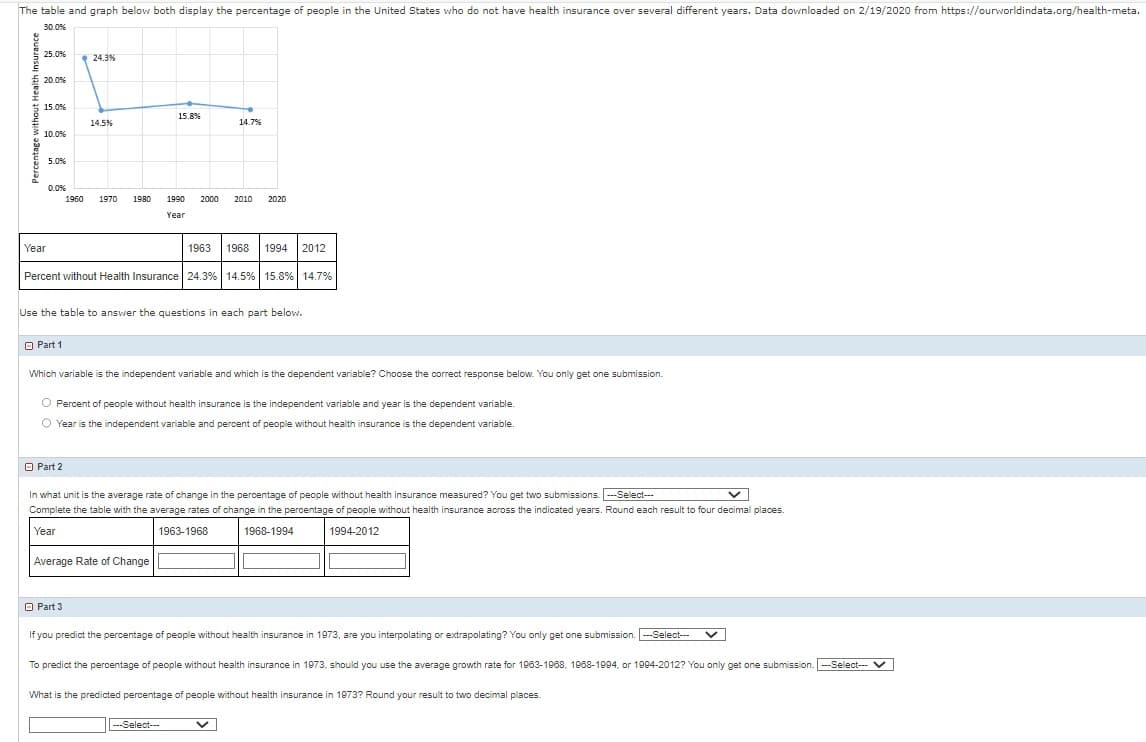
The table and graph below both display the percentage of people in the United States who do not have health insurance over several different years. Data downloaded on 2/19/2020 from https://ourworldindata.org/health-meta. 30.0% 25.0% € 20.0% 15.0% 10.0% 5.0% Year 0.0% Part 1 24.3% 14.5% 1960 1970 1980 1963 1968 1994 2012 Percent without Health Insurance 24.3% 14.5% 15.8% 14.7% Part 2 Use the table to answer the questions in each part below. 15.8% Part 3 to 14.7% Which variable is the independent variable and which is the dependent variable? Choose the correct response below. You only get one submission. 1990 2000 2010 2020 Year O Percent of people without health insurance is the independent variable and year is the dependent variable. O Year is the independent variable and percent of people without health insurance is the dependent variable Average Rate of Change In what unit is the average rate of change in the percentage of people without health insurance measured? You get two submissions. ---Select--- Complete the table with the average rates of change in the percentage of people without health insurance across the indicated years. Round each result to four decimal places. Year 1963-1968 1968-1994 1994-2012 If you predict the percentage of people without health insurance in 1973, are you interpolating or extrapolating? You only get one submission. ---Select--- く ---Select--- To predict the percentage of people without health insurance in 1973, should you use the average growth rate for 1963-1968, 1968-1994, or 1994-2012? You only get one submission. ---Select--- V What is the predicted percentage of people without health insurance in 1973? Round your result to two decimal places.
The table and graph below both display the percentage of people in the United States who do not have health insurance over several different years. Data downloaded on 2/19/2020 from https://ourworldindata.org/health-meta. 30.0% 25.0% € 20.0% 15.0% 10.0% 5.0% Year 0.0% Part 1 24.3% 14.5% 1960 1970 1980 1963 1968 1994 2012 Percent without Health Insurance 24.3% 14.5% 15.8% 14.7% Part 2 Use the table to answer the questions in each part below. 15.8% Part 3 to 14.7% Which variable is the independent variable and which is the dependent variable? Choose the correct response below. You only get one submission. 1990 2000 2010 2020 Year O Percent of people without health insurance is the independent variable and year is the dependent variable. O Year is the independent variable and percent of people without health insurance is the dependent variable Average Rate of Change In what unit is the average rate of change in the percentage of people without health insurance measured? You get two submissions. ---Select--- Complete the table with the average rates of change in the percentage of people without health insurance across the indicated years. Round each result to four decimal places. Year 1963-1968 1968-1994 1994-2012 If you predict the percentage of people without health insurance in 1973, are you interpolating or extrapolating? You only get one submission. ---Select--- く ---Select--- To predict the percentage of people without health insurance in 1973, should you use the average growth rate for 1963-1968, 1968-1994, or 1994-2012? You only get one submission. ---Select--- V What is the predicted percentage of people without health insurance in 1973? Round your result to two decimal places.

Glencoe Algebra 1, Student Edition, 9780079039897, 0079039898, 2018
18th Edition
ISBN:9780079039897
Author:Carter
Publisher:Carter
Chapter10: Statistics
Section10.6: Summarizing Categorical Data
Problem 23PPS

Related questions
Question
100%
Transcribed Image Text:The table and graph below both display the percentage of people in the United States who do not have health insurance over several different years. Data downloaded on 2/19/2020 from https://ourworldindata.org/health-meta.
30.0%
25.0%
€ 20.0%
15.0%
10.0%
5.0%
Year
0.0%
Part 1
24.3%
14.5%
1960 1970 1980
1963 1968 1994 2012
Percent without Health Insurance 24.3% 14.5% 15.8% 14.7%
Part 2
Use the table to answer the questions in each part below.
15.8%
Part 3
Which variable is the independent variable and which is the dependent variable? Choose the correct response below. You only get one submission.
T
14.7%
1990 2000 2010 2020
Year
O Percent of people without health insurance is the independent variable and year is the dependent variable.
O Year is the independent variable and percent of people without health insurance is the dependent variable.
Average Rate of Change
In what unit is the average rate of change in the percentage of people without health insurance measured? You get two submissions. ---Select---
Complete the table with the average rates of change in the percentage of people without health insurance across the indicated years. Round each result to four decimal places.
Year
1968-1994
1994-2012
1963-1968
---Select---
If you predict the percentage of people without health insurance in 1973, are you interpolating or extrapolating? You only get one submission. ---Select---
To predict the percentage of people without health insurance in 1973, should you use the average growth rate for 1963-1968, 1968-1994, or 1994-2012? You only get one submission. --Select--- V
What is the predicted percentage of people without health insurance in 1973? Round your result to two decimal places.
Expert Solution
This question has been solved!
Explore an expertly crafted, step-by-step solution for a thorough understanding of key concepts.

This is a popular solution!

Trending now
This is a popular solution!

Step by step
Solved in 4 steps

Follow-up Questions
Read through expert solutions to related follow-up questions below.
Follow-up Question
What is the predicted percentage of people without health insurance in 2020? Use average growth rate of 1994-212.

Transcribed Image Text:tage
ME
€
Percentage without Health insurance
Year
30.0%
25.0%
20.0%
35.00
10.0%
5.0%
D.ON
1960
2438
14.36
1970
1960
15.8%
14.7%
1990 2000 2010
Year
2020
1963 1968 1994 2012
Percent without Health Insurance 24.3% 14.5% 15.8% 14.7%
Use the table to answer the questions in each part below.
Solution
Follow-up Question
What is the predicted percentage of people without health insurance in 2020? Round your result to two decimal places.
Solution
Follow-up Question
What is the predicted percentage of people without health insurance in 1998? Round your result to two decimal places.
Solution
Recommended textbooks for you
Glencoe Algebra 1, Student Edition, 9780079039897…
Algebra
ISBN:
9780079039897
Author:
Carter
Publisher:
McGraw Hill

Big Ideas Math A Bridge To Success Algebra 1: Stu…
Algebra
ISBN:
9781680331141
Author:
HOUGHTON MIFFLIN HARCOURT
Publisher:
Houghton Mifflin Harcourt
Glencoe Algebra 1, Student Edition, 9780079039897…
Algebra
ISBN:
9780079039897
Author:
Carter
Publisher:
McGraw Hill
Big Ideas Math A Bridge To Success Algebra 1: Stu…
Algebra
ISBN:
9781680331141
Author:
HOUGHTON MIFFLIN HARCOURT
Publisher:
Houghton Mifflin Harcourt